FIGURE 5.

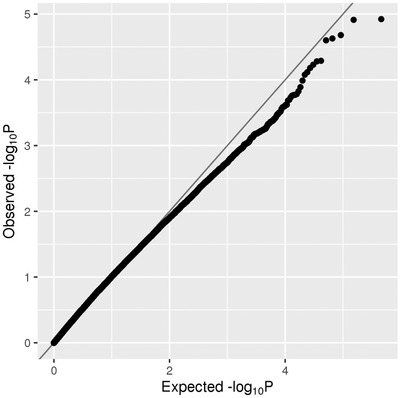
QQ plot of spatial clustering association results based on rare (MAF < = 1%) variants in the family‐based discovery data set (NIMH and NIA cohorts)

QQ plot of spatial clustering association results based on rare (MAF < = 1%) variants in the family‐based discovery data set (NIMH and NIA cohorts)