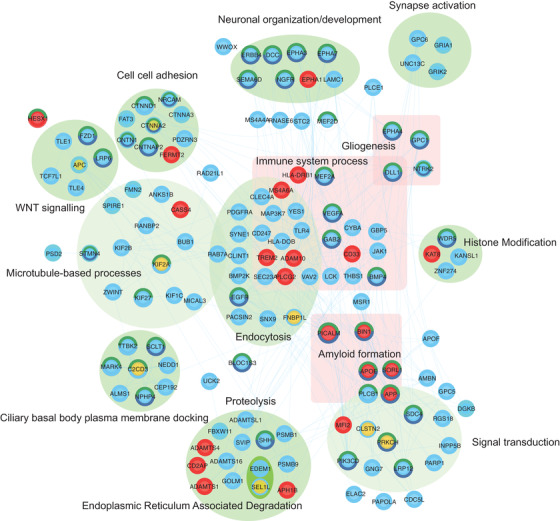
FIGURE 6.

Network of direct interactions between highly ranked SNV and regional genes and known AD‐associated genes. Direct protein‐protein relationships (blue links) between reference AD genes (red), Table 1 and Table 2 (yellow), Supplementary Table 12 and 15 (blue) protein‐coding genes. LINC00298 co‐regulated expression of directly interacting genes is highlighted (turquoise border). Proteins that are in direct interaction with genes from Tables 1 and 2 have been grouped where possible according to shared GO biological processes (green ellipse). Proteins that may not be directly interacting but are found commonly enriched in immune‐related processes are grouped (pink square). Proteins with dark green–colored borders are enriched in GO:BP nervous system development, whereas a navy blue border is enriched for generation of neurons. Gene‐gene relationships are listed in Supplementary Table 24. The network can be interactively explored via the NDEX project website 106
