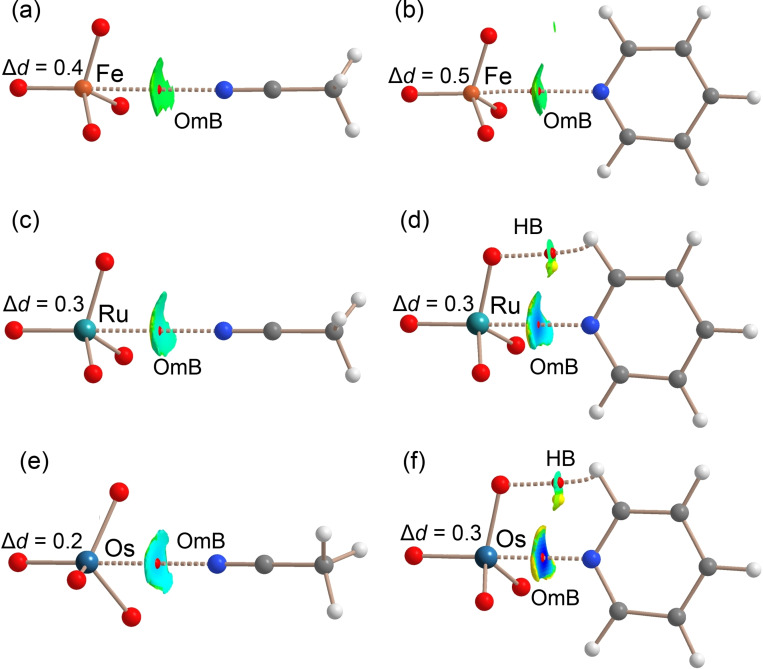
Figure 3.
a–f) PBE0‐D3/def2‐TZVP optimized geometries of six OmB complexes. QTAIM analysis: bond CPs in red and ring CPs in yellow. NCIPlot: |RGB| isosurface 0.4 a.u.; Color range 0.04 a.u. (red) ≤ (signλ 2)ρ ≤ −0.04 a.u. (blue). Only the intermolecular interactions are shown. The computed Om‐O elongation (Δd, pm) upon complexation is given.

