
Figure 10.
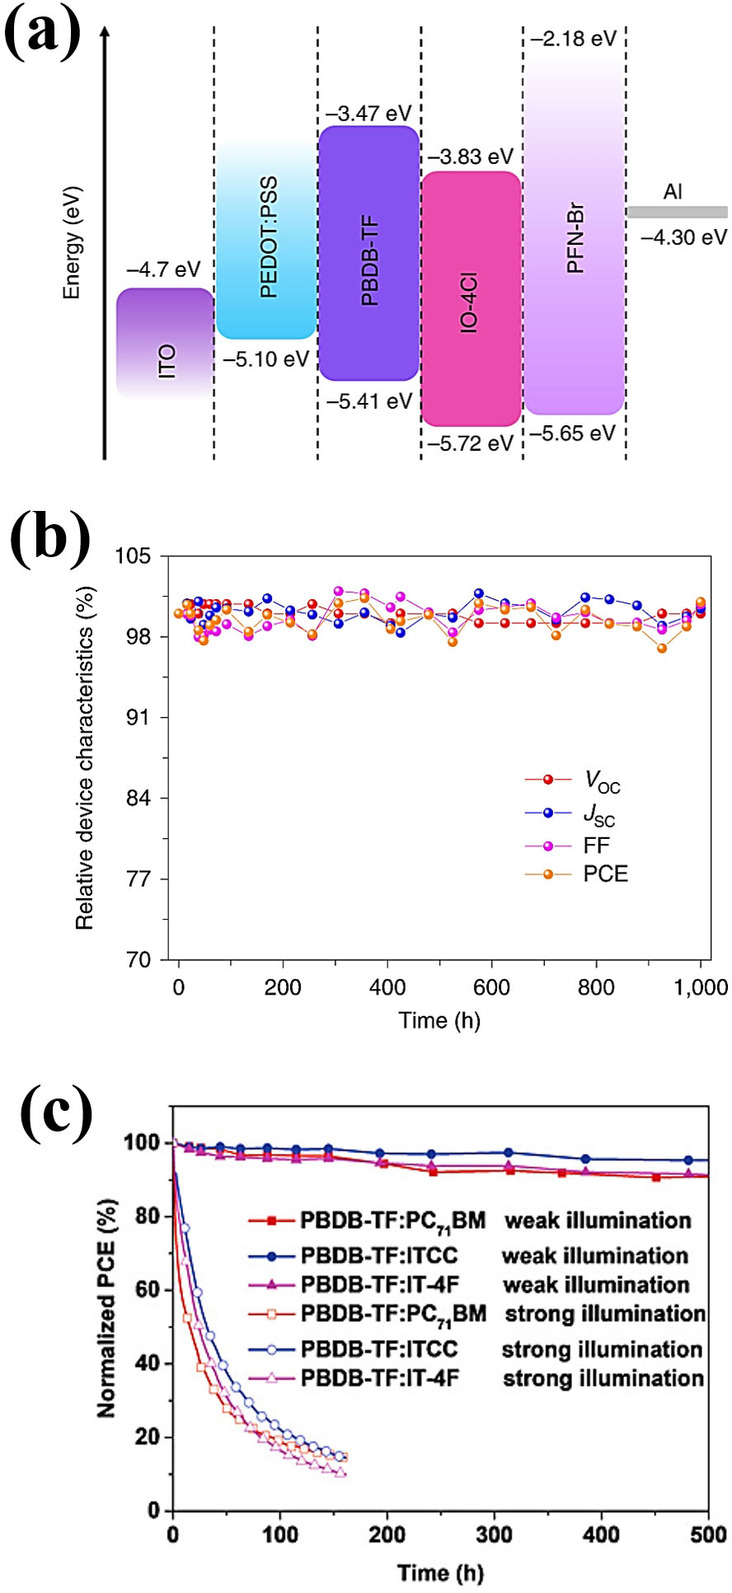
(a) Energy band diagram of conventional indoor organic photovoltaics. (b) Relative photovoltaic characteristics vs. time. Reproduced with permission from ref. [2]; copyright 2019, Nature Publishing Group. (c) Stability trends of the three different organic photovoltaic devices under continuous weak and strong illumination. Reproduced from ref. [19]; copyright 2020, Wiley‐VCH.