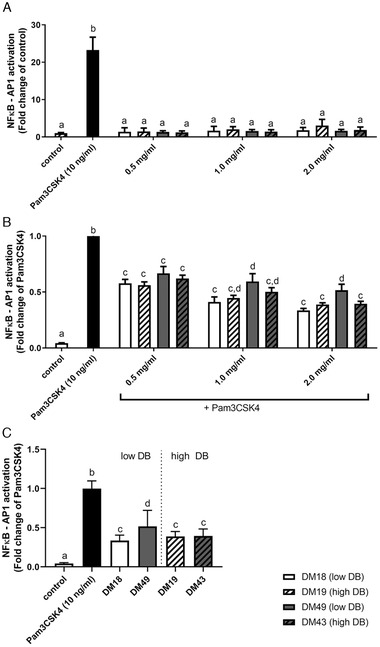
Figure 1.

Murine TLR2 activation and inhibition by pectins. A) TLR2 activation and B) inhibition of TLR2 activation of mTLR2 by DM 18 (low DB) pectin, DM 19 (high DB) pectin, DM 49 (low DB) pectin, DM 43 (high DB) 0.5, 1.0, and 2.0 mg mL−1, and C) TLR2 inhibition by low DB and high DB pectins at 2.0 mg mL−1. Data is represented as mean ± SD (n = 15). Statistical differences (p < 0.05) were quantified using one‐way ANOVA with Tukey's post‐hoc test. a–d indicate statistical differences for each pectin concentration and were compared to control and Pam3CSK4.
