
Fig 1.
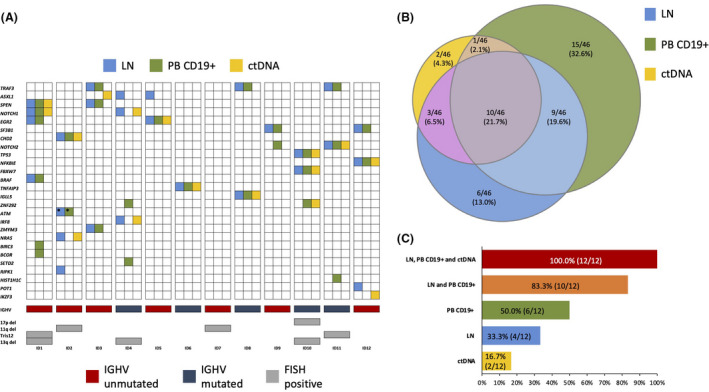
Comparison of mutation types (A) and prevalence (B, C) among anatomical compartments of small lymphocytic lymphoma (SLL). (A) Case level mutational profiles of 12 SLL patients clustered according to the different anatomical compartments. Each column represents one tumour sample, each row represents one gene. Mutations identified in lymph node biopsies (LN) are represented by light blue boxes, mutations identified in CD19+ peripheral blood (PB) cells by green boxes and mutations identified in circulating tumour DNA (ctDNA) by yellow boxes. IGHV mutational status, and fluorescent in‐situ hybridization (FISH) karyotype are plotted below the heatmap. *denotes that different ataxia‐telangiectasia mutated mutations have been identified in LN and in CD19+ cells. (B) Venn diagram representing the comparison of different mutations among the three anatomical compartments. Dimensions of the diagrams are proportional to the number of mutations identified in each compartment. (C) Histogram representing the percentage of patients in which the analysis of single or multiple compartments is able to identify all SLL gene mutations that are present among the ones included in our panel.