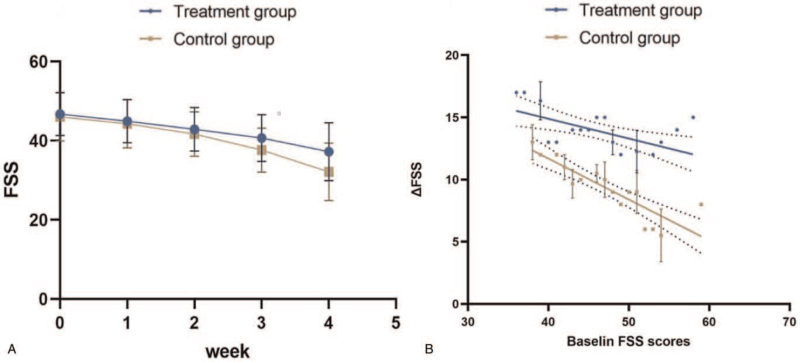
Figure 2.
Comparison of BMI scores of 2 groups in different time periods. Comparison of 2 groups of patients in different time periods. A: Comparison of FSS scores between the 2 groups before and after intervention. B: Comparison of FSS scores between the 2 groups before and after followed up. C: Comparison of FMA scores of 2 groups of patients in different time periods. D: Comparison of MBI scores of 2 groups of patients in different time periods. FAM = Fugl-Meyer movement-function assessment, FSS = fatigue severity scale.

