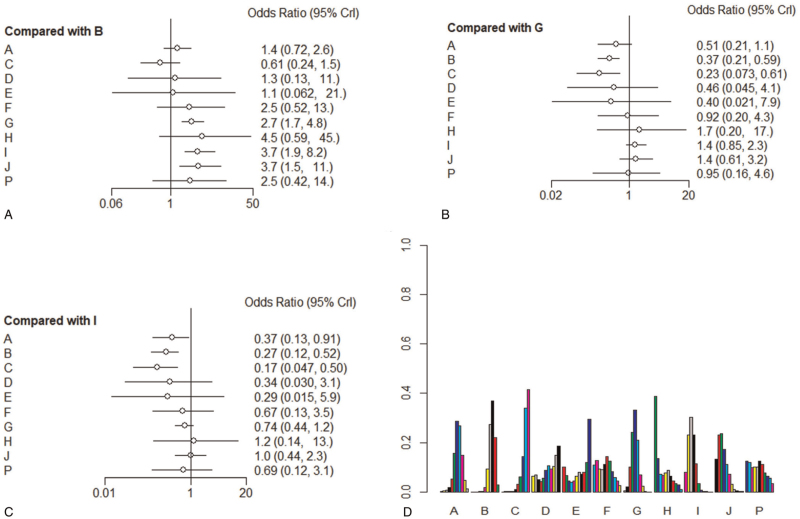
Figure 5.
Forest graph and ranking probability graph on outcome ②: A–G, I–J: Same with Fig. 4. H: Tripterygium wilfordii polyglycoside, P: IVIg+eculizumab. (A–C): Forest plots (References were Placebo, PE, and IVIg, respectively), indicate relative effect results compared with placebo group, PE, and IVIg. (D): Ranking probability graph of outcome ②. The heights of bars represent the probability to be a certain rank; for every therapy, bars from left to right represent ranks from best to worst.

