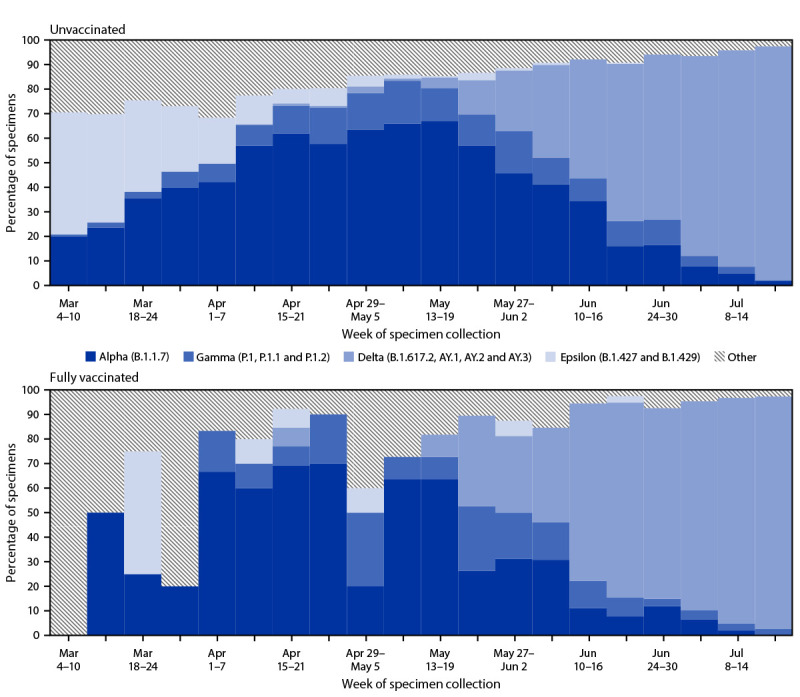
FIGURE.

Percentage of SARS-CoV-2 variants* identified among sequenced specimens, by unvaccinated (n = 5,994) and fully vaccinated (n = 648) status† — California, March–July 2021
Abbreviation: FDA = Food and Drug Administration.
* Variants and their associated SARS-CoV-2 (Pango) lineages were defined according to the CDC classification system at the time of the report (https://www.cdc.gov/coronavirus/2019-ncov/variants/variant-info.html). The four most commonly identified variants were displayed separately, and all other identified lineages were grouped together as other variants.
† Fully vaccinated persons had completed all recommended doses of an FDA-authorized COVID-19 vaccine, including Pfizer-BioNTech, Moderna, and Janssen (Johnson & Johnson) ≥14 days before the positive SARS-CoV-2 test date. Unvaccinated persons had no record of receiving an FDA-authorized COVID-19 vaccine ≥14 days before the positive SARS-CoV-2 test date. Partially vaccinated persons had completed a single dose of Pfizer-BioNTech or Moderna COVID-19 vaccine ≥14 days before the positive SARS-CoV-2 test date; these persons were not included in the current analysis because of sample size limitations.
