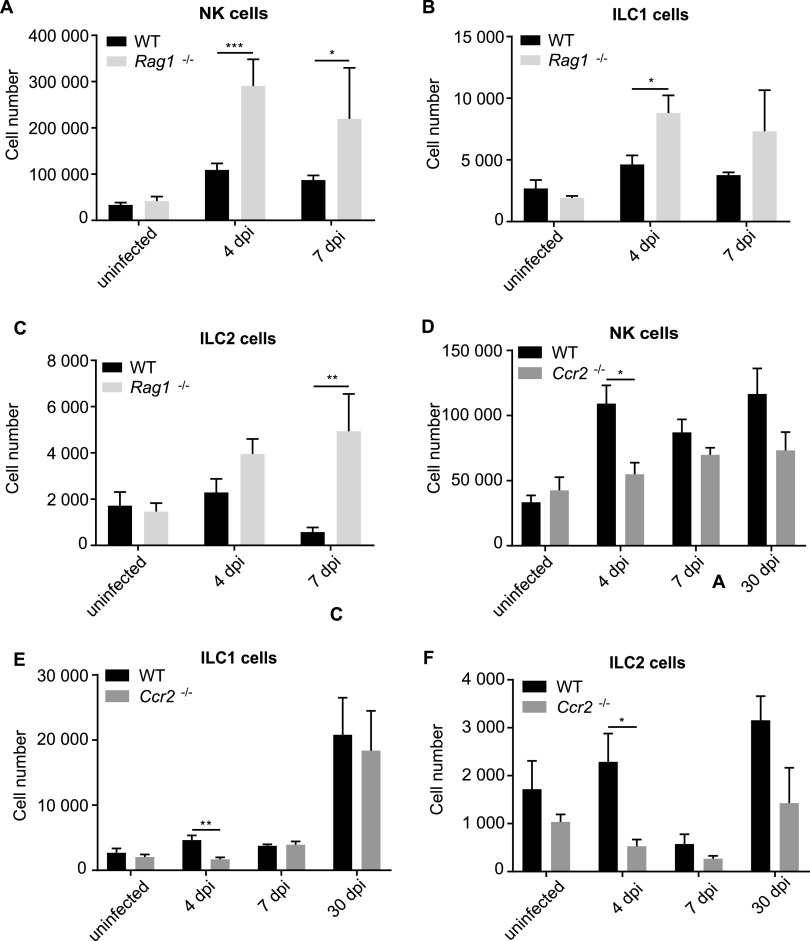
FIG 5.
Dynamics of ILC numbers in whole FGTs comparing WT, RAG1−/−, and Ccr2−/− mice upon infection with C. muridarum. wt, RAG1−/−, and Ccr2−/− mice were infected intravaginally with 5 × 10⁵ IFUs of C. muridarum. FGTs were isolated at the indicated time points, and leucocytes of whole FGTs were analyzed via immunostaining and subsequent flow cytometry. Absolute cell numbers were obtained by including a defined number of reference beads. (A to C) Comparison of wt and RAG1−/− mice. (D to F) Comparison of wt and CCR2−/− mice. (A, D) NK cells were defined as CD45+, Lin(CD3, CD5, CD19, TCRβ, TCRγδ, F4/80, FcεR1α, Ly6G)−, NK1.1+, Eomes+ cells. (B, E) ILC1s were defined as CD45+, Lin−, NK1.1+, Eomes− cells. (C, F) ILC2s were defined as CD45+, Lin−, CD127+, ST2+, GATA3+ cells. Data show means and SEM of 3 to 9 mice. The exact numbers of mice and experiments are separately listed in Table S1. Significance between means was tested by unpaired t test (*, P = 0.05). All statistically significant differences are indicated.

