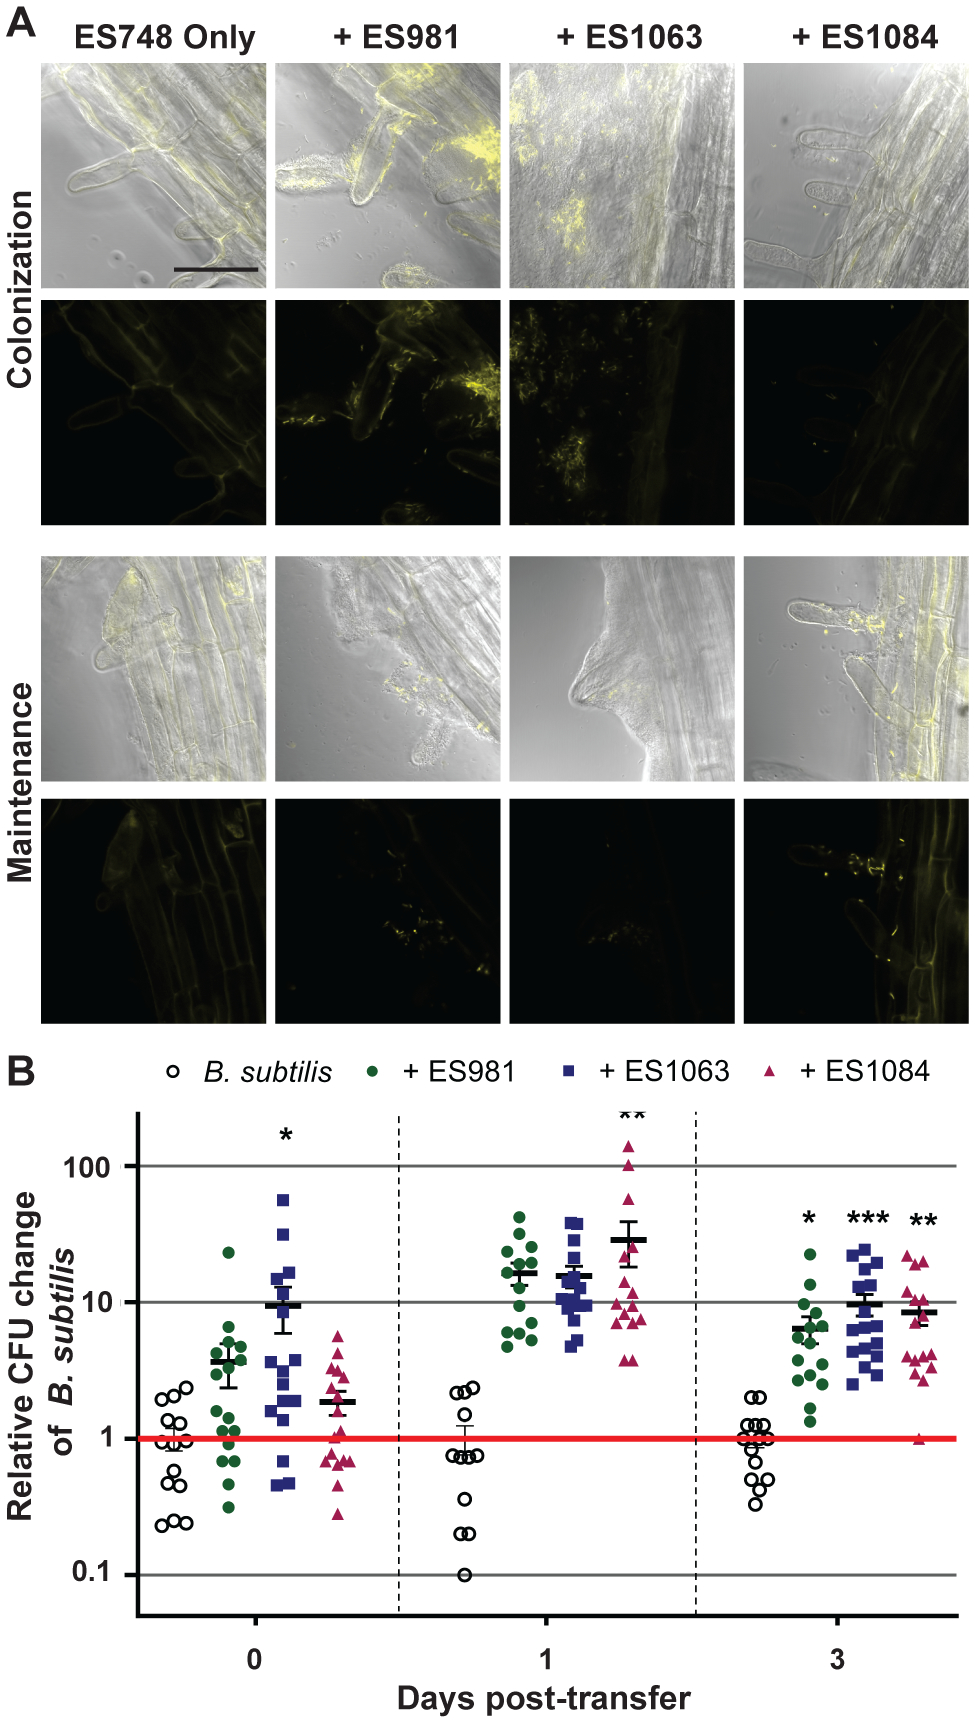
Fig. 4.

A, Distributions of Bacillus subtilis on the lower regions of plant roots following colonization (top) and maintenance (bottom) when inoculated either alone or with the indicated strains. Fluorescent cells were false colored yellow in both the DIC-fluorescent image overlays and the fluorescent images. Images from each section were collected from at least two technical replicates of three independent biological replicates of these experiments. Bar = 50 μm. B, Plant root attachment of B. subtilis following colonization (0 days) and maintenance (1 and 3 days) is increased by cocolonization with either ES981, ES1063, or ES1084. Differences in B. subtilis CFU per seedling when coinoculated with another strain are reported as log-fold changes compared with the average B. subtilis CFU per seedling of three replicates in the same biological experiment. Error bars = standard error of the mean; *, **, and *** indicate P < 0.05, 0.01, and 0.001, respectively.
