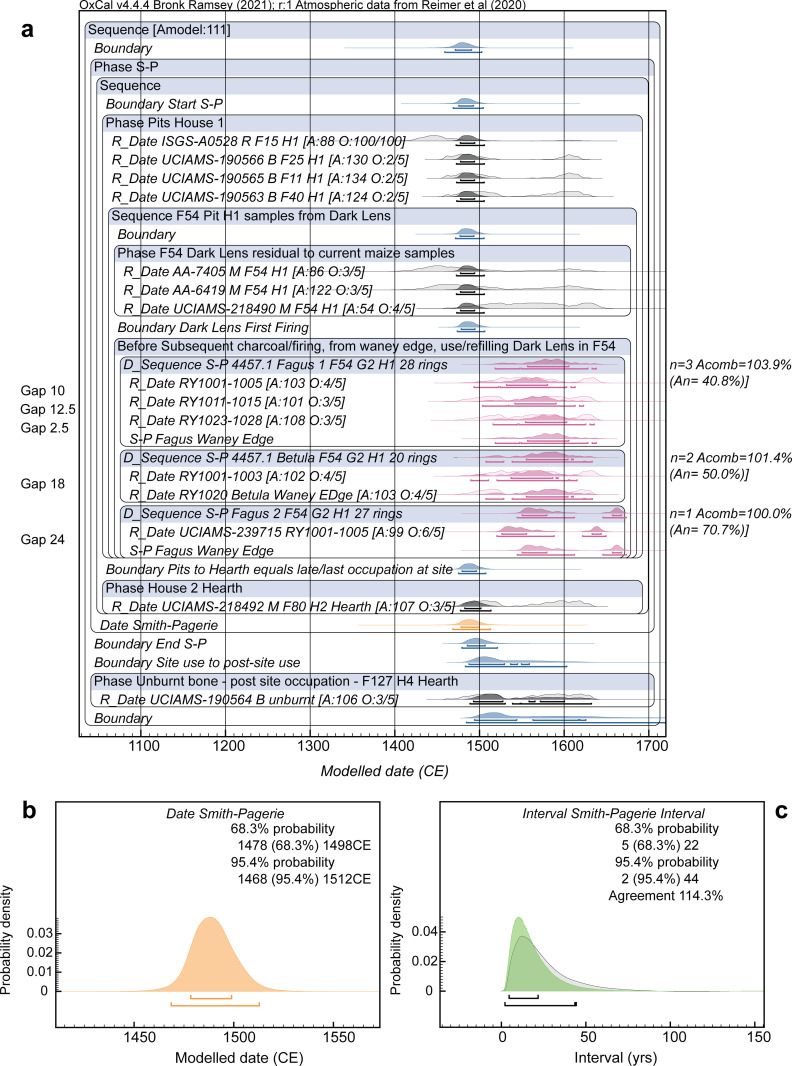
Fig 5. Dating model and results for Smith-Pagerie (S-P) Model 1.
a. Site dating model with the OxCal key words and boxes describing the model exactly. Light-shaded distributions show the non-modelled calibrated calendar probabilities; the dark shaded distributions show the modelled probabilities applying the model. The lines under each distribution show the modelled 68.3% and 95.4% highest posterior density (hpd) ranges. The individual OxCal Agreement values (A) and the Outlier (O) values (Posterior/Prior) are shown (note in the case of the Charcoal Outlier model these are always 100/100). b. Detail from a. showing the Date query result for the overall Smith-Pagerie Phase. c. Interval query result, applying the LnN(ln(20),ln(2)) prior, showing the probability for the period of time between the start and end Boundaries for the site Phase in a. versus the prior (there is good agreement). Data from OxCal [91, 92, 115] version 4.4.4 of 2021 using IntCal20 [111] with curve resolution set at 1-calendar year.

