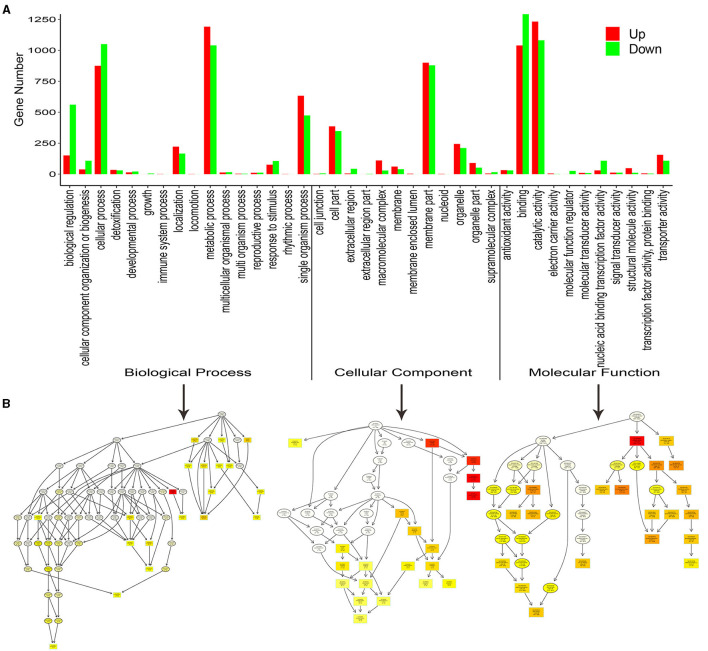
Figure 3.
Functional GO and Kyoto Encyclopedia of Genes and Genomes (KEGG) pathway classification of differentially expressed genes. (A) Enriched GO terms are shown on the x-axis, and the numbers of the up- and down-regulated differentially expressed genes are shown on the y-axis. (B) Directed acyclic graphs of three main categories are displayed in thumbnail view. The nodes are color-based on the q-value, and a darker color indicates a higher confidence level. The GO terms are presented at the horizontal node position.

