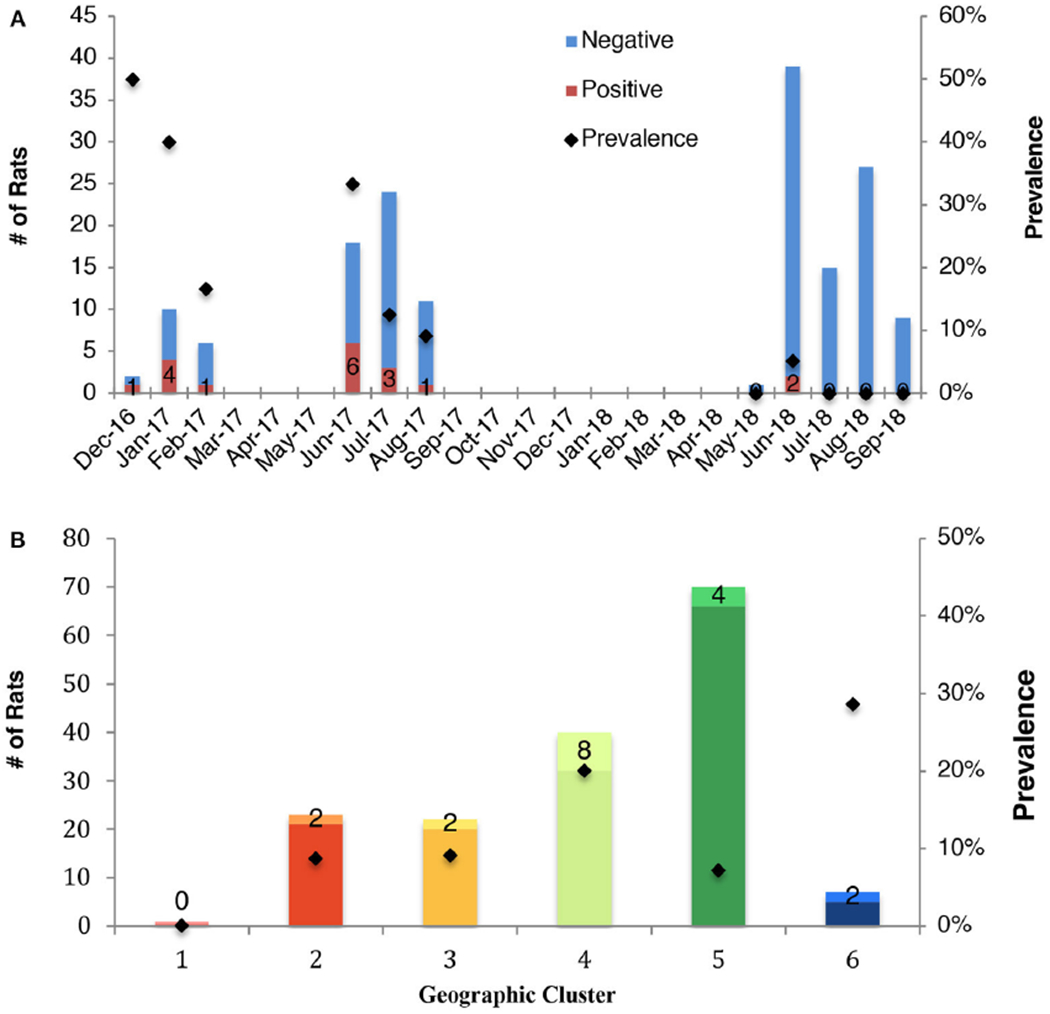
FIGURE 2 |.

Prevalence of influenza A virus in rats according to (A) month of sampling (all months, including those eliminated from statistical analysis are shown), and (B) geocluster within the City of Boston. The total sampling effort is shown by the vertical bars. Prevalence is indicated by black marker and the number of positive rats is reported.
