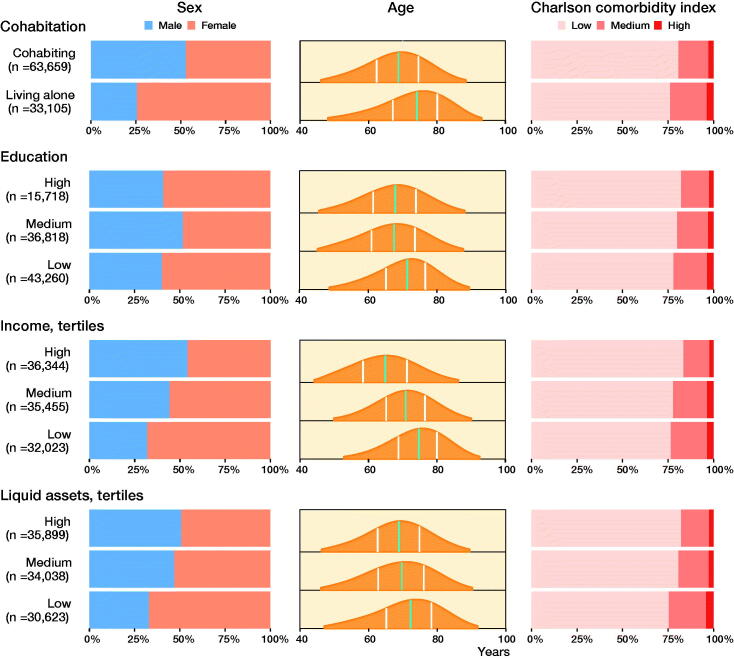
Figure 3.
Demographics with distribution of sex, age and Charlson comorbidity index score in the 4 SES markers. Sex and Charlson comorbity index score distribution is given in percent on the x-axis. Age distribution is shown with age on the x-axis, green line is median age and white lines marks the first and third quartile.

