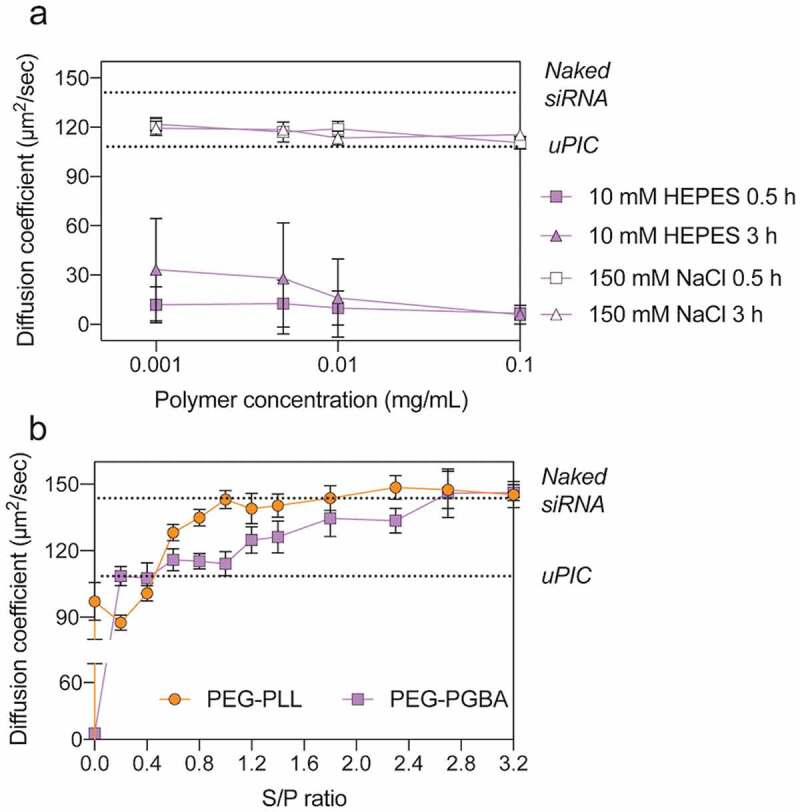
Figure 5.

(a) Diffusion coefficient of PEG-PLL uPICs and PEG-PGBA PICs loading Cy5-labeled siRNA (N/P = 2) serially diluted with 10 mM HEPES or 150 mM NaCl and incubated for 0.5 and 3 h. (b) Diffusion coefficient of PEG-PLL uPICs (orange circle) and PEG-PGBA PICs (purple square) loading Cy5-labeled siRNA (N/P = 2) after incubation with heparin sulfate at different [sulfate in heparin]/[phosphate in siRNA] (S/P) ratios. The lower dashed line and the upper dashed line indicate the diffusion coefficient of uPIC and naked siRNA, respectively. All results are expressed as the mean ± s.d. (n = 10)
