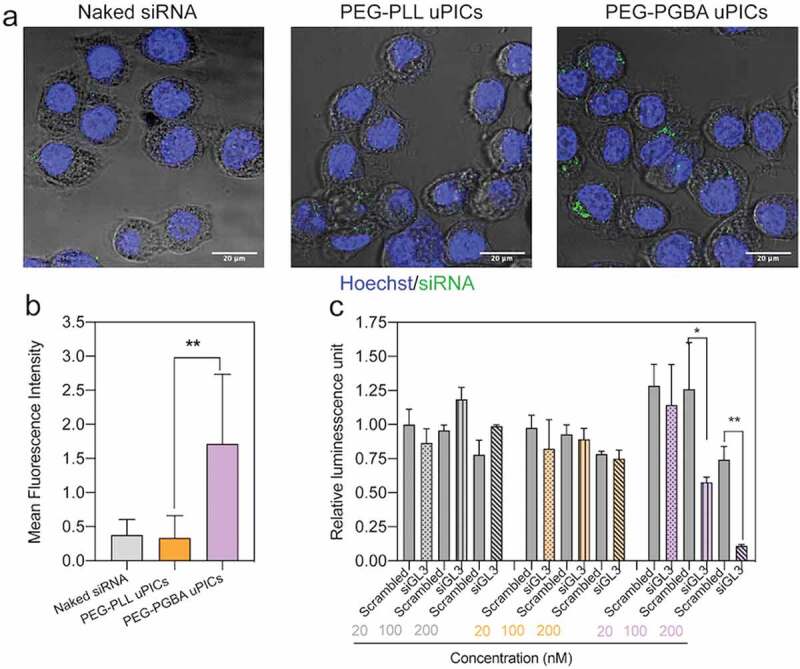
Figure 7.

In vitro performance of PEG-PLL uPICs and PEG-PGBA uPICs. (a) Cellular uptake efficiency in cultured Hela-luc cells incubated for 24 h with naked siRNA, PEG-PLL uPICs and PEG-PGBA uPICs. Scale bars = 20 μm. (b) Quantification of cellular uptake measured by the mean fluorescence intensity of the pixels corresponding to FITC. Data represent the mean ± s.d. (n = 20 cells). (c) Gene silencing efficiency of naked siRNA (gray column), PEG-PLL uPICs (orange column) and PEG-PGBA uPICs (purple column) loaded with scrambled siRNA or siGL3 at 20, 100 and 200 nM siRNA in cultured Hela-luc cells after 24 h. Data represent the means ± s.d. (n = 4). p < 0.05 (*) and p < 0.01 (**) were calculated by the Welch’s t-test
