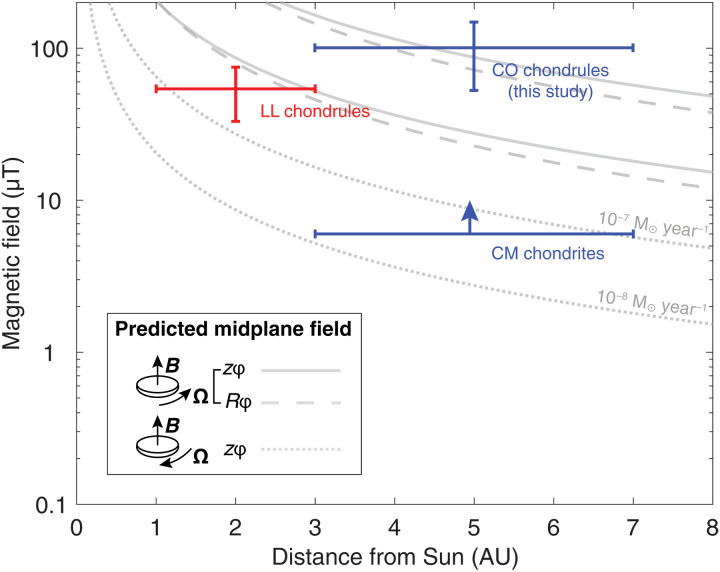
Fig. 3. Comparison between paleomagnetic constraints and model predictions for the solar nebula magnetic field intensity.
Shown are paleointensity records from the first 3 Ma after CAI formation: LL chondrules (11), CM chondrites (13), and CO chondrules (this study). Solid and dashed lines show predicted midplane magnetic field, due to vertical-toroidal [zφ; equation 3 of (10)] and radial-toroidal [Rφ; equation 2 of (10)] Maxwell stresses, respectively, assuming the nebular magnetic field and sense of disk rotation are aligned. Dotted lines show the field due to vertical-toroidal Maxwell stresses [zφ; equation 3 of (10)] assuming the nebular magnetic field and sense of disk rotation are antialigned. Top and bottom curves were calculated assuming accretion rates of 10−7 and 10−8 M☉ year−1, respectively.

