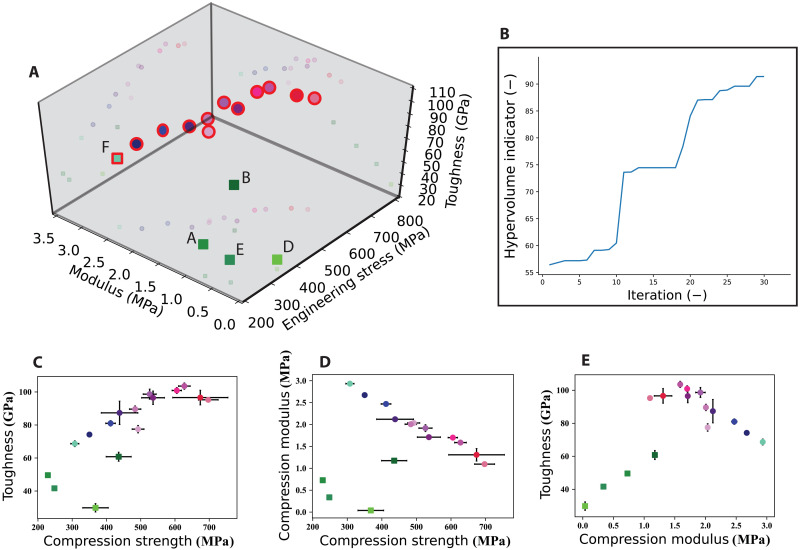
Fig. 4. Performance results.
(A) 3D plot of the performance space, including the performance of five primary formulations A, B, D, E, and F in green squares, and the points on the Pareto front obtained after 30 algorithm iterations, circled in red. Primary C is missing as it is too brittle to test in a pure form. Note that primary ink F lies on the Pareto front. (B) Hypervolume improvement plot. Hypervolume indicator shows the actual improvement of the Pareto front over iterations of the optimization. (C to E) Corresponding 2D plots of pairs of performance objectives.

