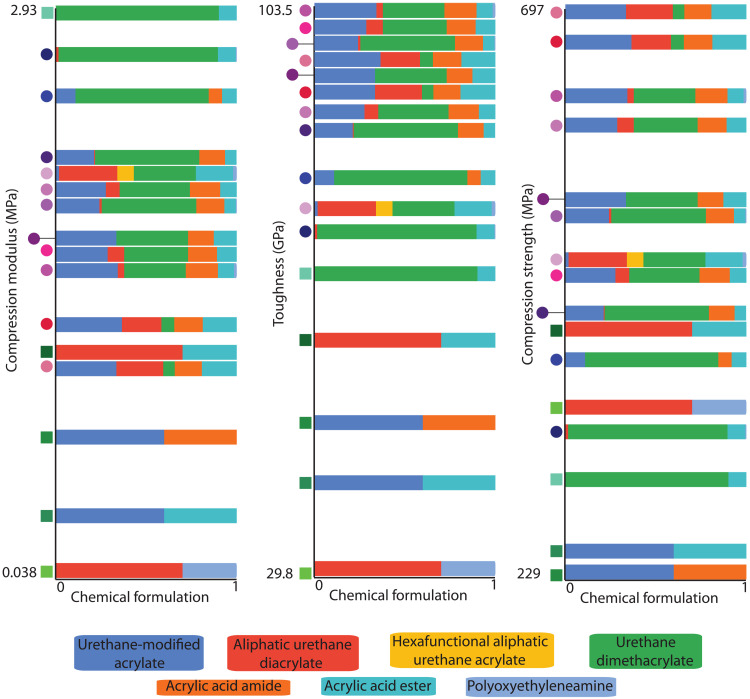
Fig. 6. Pareto optimal compositions.
Comparison of Pareto optimal (circle) performance characteristics with initial primary formulations (green squares) shows the relationship between performance and formulation ingredients. Base formulation ingredient compositions are indicated via the bar graphs in the chart. Note that the highest compression modulus point is both the primary formulation point (green square) and Pareto optimal.

