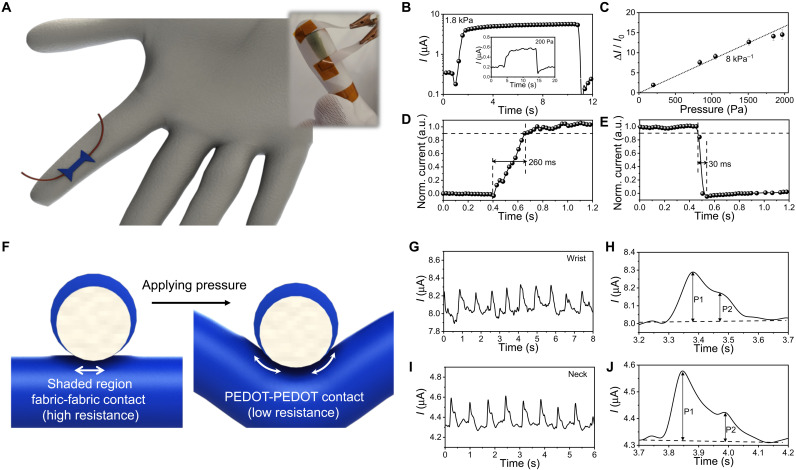
Fig. 3. oCVD PEDOT on the glove for BP sensor.
(A) Schematic and photo image of oCVD PEDOT sensor fabricated on a polyester glove. (B) Transient current curve, recorded at 0.1 V under applying a pressure of 1.8 kPa. The inset demonstrates current change occurring under a pressure of 200 Pa. (C) Current change occurring under different pressure. The slope represents the sensitivity of the sensor. (D) Response and (E) recovery times, measured applying 1.8 kPa. (F) Schematic showing a working mechanism of the oCVD PEDOT pressure sensor. (G to J) BP measurements. (G) The radial artery BP recording by placing the sensor on the wrist and (H) an extended image of it showing a single pulse, (I) the carotid artery BP recording by placing the sensor on the neck, and (J) an extended image of it showing a single pulse. Photo credit: Hyeonghun Kim, Purdue University.

