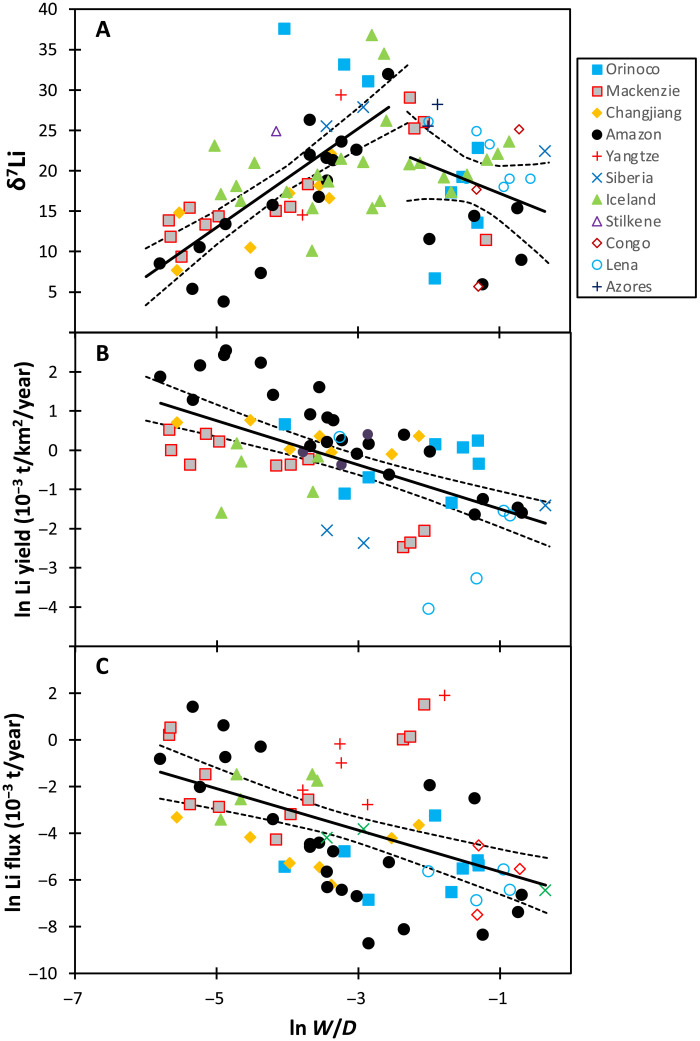
Fig. 5. Modern riverine Li isotope data.
(See section S6 for references). (A) Shows riverine- δ7Li as a function of the natural logarithm of the weathering intensity (W/D). (B) Shows the natural logarithm of the weathering intensity versus the log of the Li yield and (C) shows the natural logarithm of the riverine Li flux as a function of the log of the weathering intensity. The solid lines are the regression lines, and the dashed lines represent the 95% confidence limits, which are also used to estimate uncertainty in Fig. 6. In (A), trends are shown separately for low- to medium-intensity and high-intensity weathering regimes (25). Combined, this figure suggests that an increase in Li flux (and Li yield) and a decrease in riverine δ7Li all imply lower weathering intensity (i.e., relatively higher erosion rates) (25).

