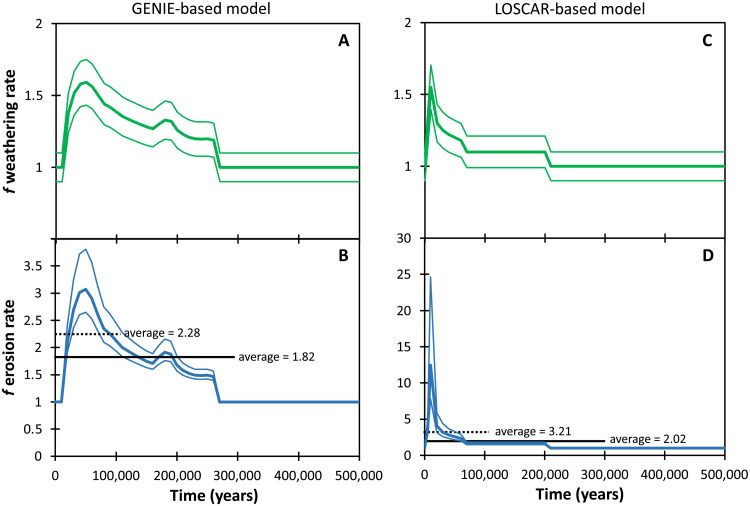
Fig. 6. Increase in silicate weathering rate, relative to pre-PETM values.
Weathering rate estimates from the GENIE (A) and LOSCAR (C) models; the corresponding increases in erosion rates are shown in (B) and (D), respectively, based on those models and the modeled and modern riverine Li isotope ratios. The uncertainty in the erosion rate stems from the uncertainty in weathering rates in the model and the uncertainty in the modern riverine δ7Li versus W/D curve (Fig. 5). The dotted and thick black lines represent the averages for 100- and 300-ka intervals.

