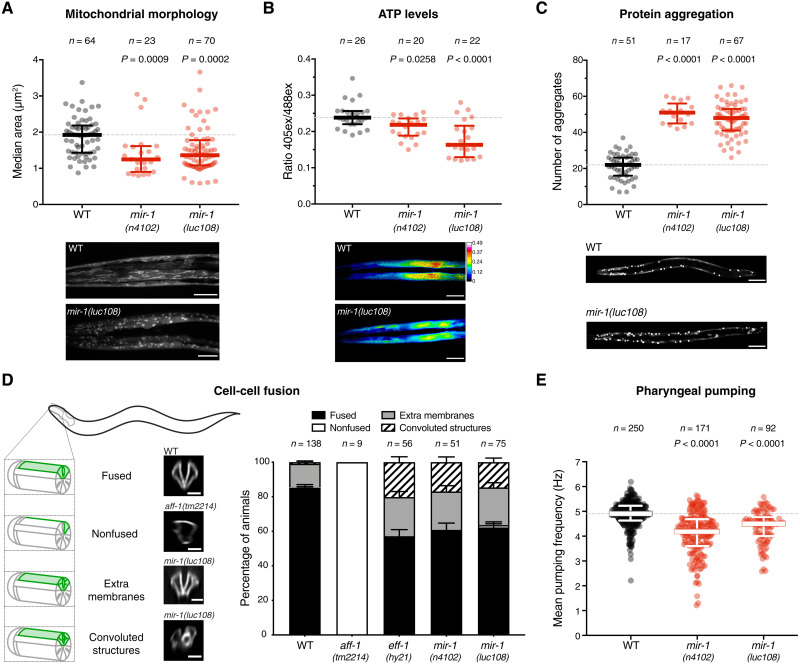
Fig. 1. Absence of miR-1 causes diverse muscle defects in C. elegans.
(A) Live L1 larvae of the indicated genotypes, expressing a mitochondria-localized GFP reporter in body-wall muscles, were imaged by confocal microscopy. Automated analysis (see Materials and Methods) was used to extract median mitochondria area (and other parameters in fig. S2D). mir-1 mutant animals have smaller mitochondria in muscle. P values by Kruskal-Wallis test are indicated. Representative images are shown. Scale bars, 10 μm. WT, wild type. (B) Live L1 larvae expressing a ratiometric ATP sensor were imaged by confocal microscopy. Automated analysis (see Materials and Methods) was used to extract the emission ratio at 405- and 488-nm excitation (ex) wavelengths. Mir-1(n4102 and luc108) animals have reduced ATP concentration in muscle. P values by Kruskal-Wallis test are indicated. Representative images are shown. Scale bars, 10 μm. (C) L4 animals of the indicated genotypes expressing the aggregation-prone Q40::YFP reporter were imaged, and the number of aggregates per animal was counted. Mir-1 mutant animals have more aggregates. P values [one-way analysis of variance (ANOVA)] are indicated. Representative images are shown. Scale bars, 50 μm. (D) Left: Schematic representation of the cell-cell fusion assay: pm3DL and R fusion is assessed by the expression of a pm3DR-specific membrane marker (green). If fusion occurs, then the whole pm3D outline is labeled (fused), whereas if not, only pm3DR remains labeled (nonfused). If membrane trafficking is impaired or fusion is not completely achieved, then extra membranes or convoluted structures are observed. Representative images are shown. Scale bars, 20 μm. Right: Quantification of the cell-cell fusion events. P value (χ2) <0.0001. (E) Pumping frequencies of wild-type and mir-1(n4102 and luc108) animals were extracted from electropharyngeograms (EPGs) conducted with the ScreenChip System in the presence of 10 mM serotonin. Mir-1 mutant animals have reduced pumping frequency. P values by Kruskal-Wallis test are indicated. n is the number of animals analyzed.

