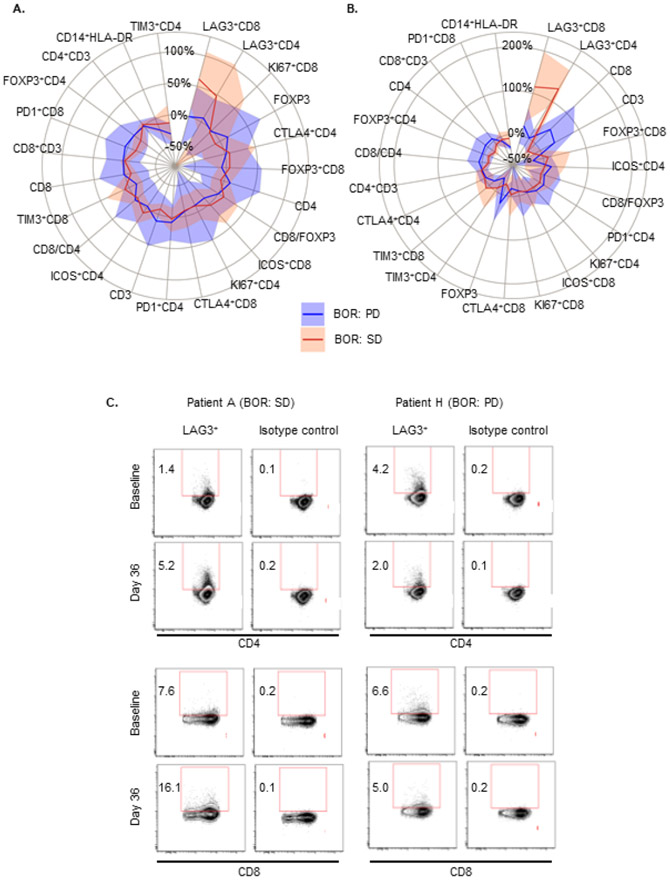
Figure 3.
Peripheral blood immune cell subset changes by response per RECIST. Percentage change from baseline to Cycle 1 Day 8 (A) and Cycle 1 Day 36 (B). Solid lines indicate the median percent change from baseline; shaded areas represent the median absolute deviation. Day 8: PD, n = 16; SD, n = 8; all markers had observations from all patients with the exception of CD14+HLA-DR where PD, n = 9, and SD, n = 8. Day 36: PD, n = 7; SD, n = 7; all markers had observations from all patients with the exception of CD14+HLA-DR where PD, n = 4, and SD, n = 6. (C). FACS analysis for LAG3+CD4 and LAG3+CD8 cell subsets at Cycle 1 Day 36 in peripheral blood from a patient who had a BOR of SD (Patient A) and PD (Patient H). Abbreviations: BOR, best overall response; PD, progressive disease; SD, stable disease.

