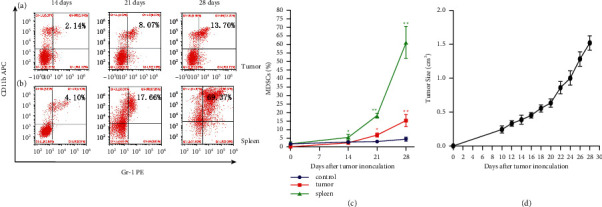
Figure 2.

The percentage of MDSCs in the spleen and tumor tissue increased with time after subcutaneous injection in mice. Mice were executed at the time points of 14 days, 21 days, and 28 days after inoculated with RM-1 cells; the tumor tissue ((a), (c)) and spleen ((b), (c)) were dissociated and prepared as single cell suspensions, respectively; then, investigate the percentage of MDSCs in each group by flow cytometry. Tumor size was detected by the caliper every two days, and the tumor growth curve of mice bearing RM-1 tumors is shown (d). Percentage of MDSCs in the normal mice spleen as the control group. ∗P < 0.05 and ∗∗P < 0.01 compared with the 14 days group.
