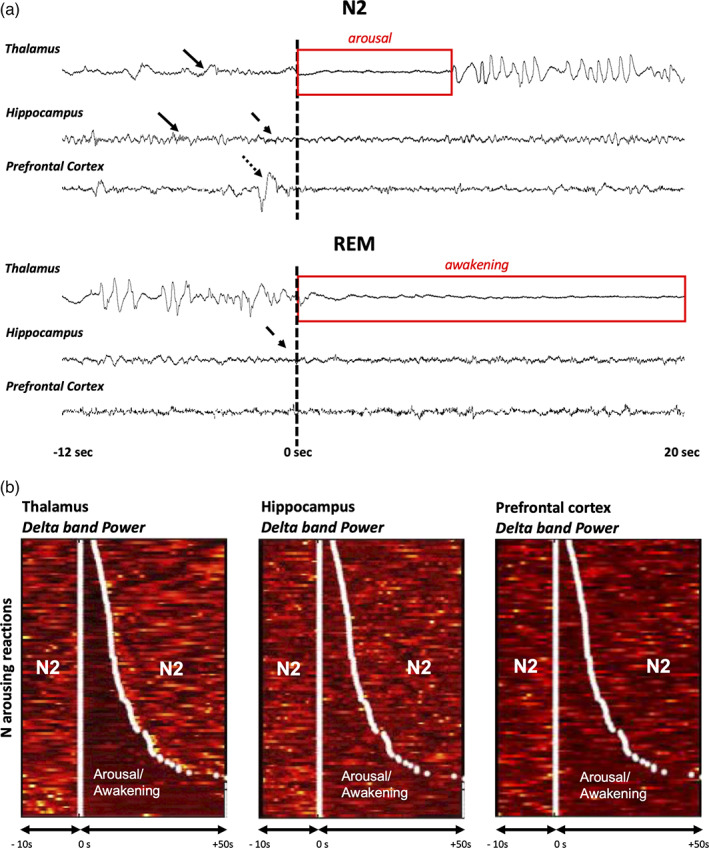
FIGURE 3.

Examples ISAR in the hippocampus and in the prefrontal cortex: raw data and time‐frequency analysis. (a) Examples of ISAR detected using the thalamic activity, in the thalamus, the hippocampus and the prefrontal cortex of patient #2, during N2 (arousal, top) and REM sleep (awakening, bottom). T = 0 s corresponds to the onset of the arousal/awakening in the thalamus. In N2, sleep spindles are observed in the thalamus and the hippocampus structures (black arrows). In REM, the typical high delta activity is observed in the thalamus. Note the discrete asynchrony between the three structures: in the N2 example, the increase in high frequencies in the hippocampus (dashes black arrow) and a high amplitude slow wave in the prefrontal cortex (dotted black arrow) precede the ISAR onset of the thalamus; in the REM example, the increase in high frequencies in the hippocampus (dashes black arrow) is observed before the ISAR onset in the thalamus, while few modifications are observed in the prefrontal cortex. (b) Time frequency‐representation of ISAR ordered by duration in the same patient in N2. The signal power in the delta band is represented in the thalamus, in the hippocampus, and in the prefrontal cortex. N arousals are ordered by duration so that the shortest is at the top and the longest is at the bottom. White points delimit the onset and the end of the arousals according to the scoring performed on the thalamus lead. The figure shows that the strong decrease in the thalamus delta power, used to delimit ISAR, is also visible in the hippocampus and in the prefrontal cortex, and exhibits overall a similar timing
