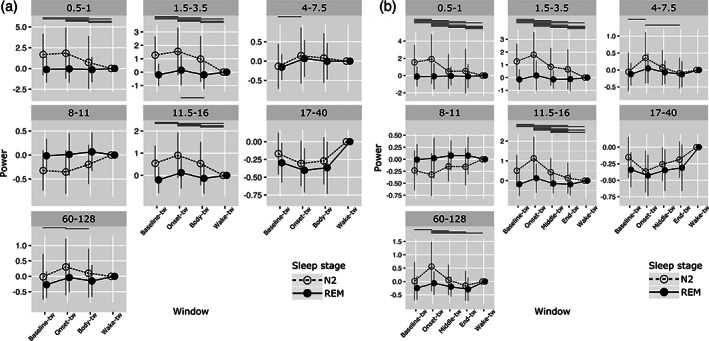
FIGURE 5.

Evolution of spectral power of the signal during sleep, ISAR, and wakefulness in the prefrontal cortex. Mean power (±SD) in different frequency bands (from low delta to gamma). (a) First analysis, during selected temporal windows: baseline‐tw, onset‐tw and body‐tw, and wake‐tw. (b) Second analysis, during selected temporal windows: baseline‐tw, onset‐tw, middle‐tw, end‐tw and wake‐tw. Transparent circle: N2 sleep; Black circle: REM sleep. Significant differences between time windows (adjusted p‐values) are presented on the figure with horizontal lines located at the top (N2) or the bottom (REM) of each frequency‐band graph (detailed statistical analyses are presented in Tables S3 and S4)
