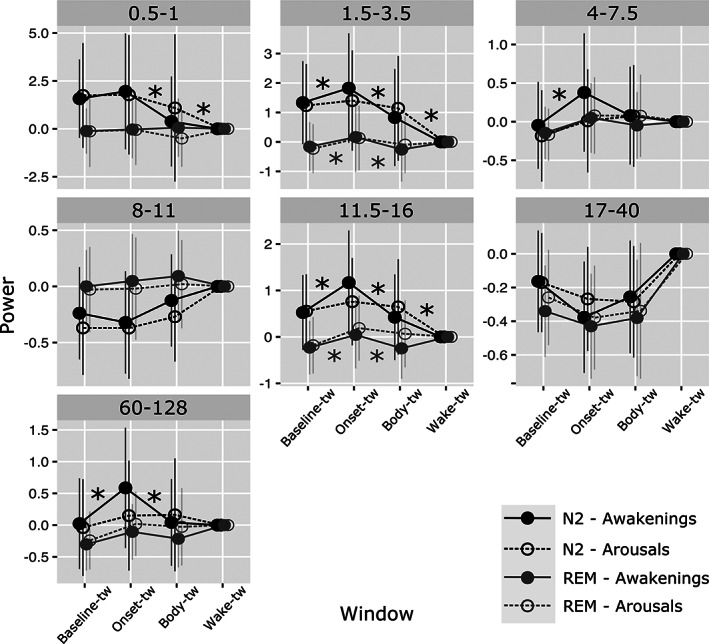
FIGURE 6.

Evolution of spectral power of the signal during sleep, ISAR, and wakefulness in the prefrontal cortex according to the duration of ISAR. Signal power in selected time windows (baseline‐tw, onset‐tw and body‐tw, and wake‐tw) is shown in the prefrontal cortex for arousals (3–15 s, transparent circles and dotted lines) and awakening (15 s to 2 min, full circles, continuous line) in N2 (black) and REM (gray) sleep. Statistically significant differences between arousals and short awakenings for contrast between baseline‐tw and onset‐tw, between onset‐tw and body‐tw, and between body and wake‐tw are indicated with stars. In N2, and in a less extent in REM, longer ISAR are associated with a greater early increase and greater secondary decrease in low and fast activities, with activity during the second part of the arousing reaction being closer to wake‐like activity than is the case for short ISAR
