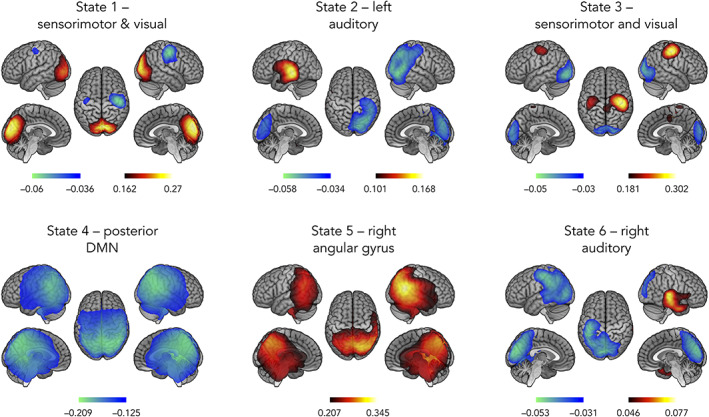
FIGURE 1.

Spatial topographies of the 6 HMM transient states. Red scale refers to the degree of power increase during state visit and blue scale is related to power decrease. These scales are measured in terms of a partial correlation, and as such, have no units. The correlation values have been thresholded between 60% and 100% of the maximum correlation for each state and networks labeled according to the local maxima. Topographically, states 1 and 3 showed an inverse modulation of power between visual (increased power, state 1; decreased power, state 3) and sensorimotor (decreased power, state 1; increased power, state 3) networks. States 2 and 6 combined an increased power in lateral temporal cortex (left temporal, state 2; right temporal, state 6) and a decreased power at contralateral parietal lobe (right parietal, state 2; left parietal, state 6). State 4 showed decreased power in posterior nodes of the DMN including left and right angular gyri and posterior midline cortices (i.e., precuneus and posterior cingulate cortex). State 5 show increased power at the bilateral temporo‐parietal junction (TPJ) maximal at the right angular gyrus
