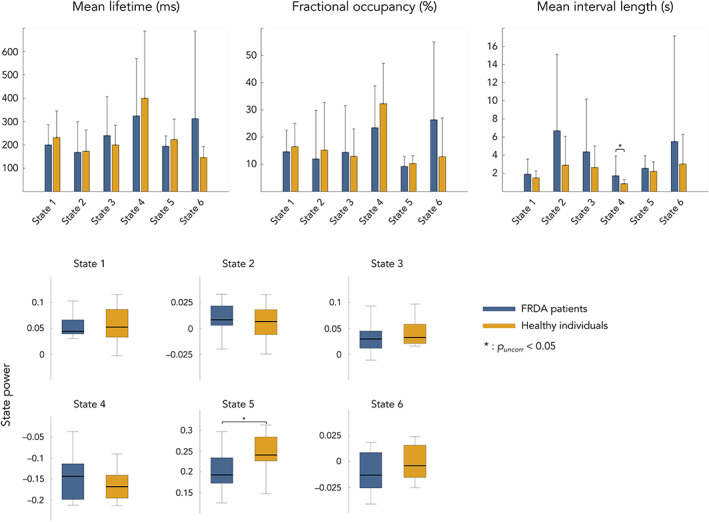
FIGURE 2.

Top: Mean and standard error of mean lifetime (left), fractional occupancy (center) and mean interval length (right) associated to each transient state and subjects Bottom: Mean and standard error of state power levels (orange, healthy; dark blue, FRDA). Of notice, power levels values correspond to partial correlation and, as such, have no units. Statistical differences between groups are represented by bars along with p‐value. State numbers and corresponding networks names refer to Figure 1 (state 1 = sensorimotor and visual state; state 2 = left auditory state; state 3 = sensorimotor and visual state; state 4 = posterior DMN state; state 5 = right angular gyrus state; state 6 = right auditory state)
