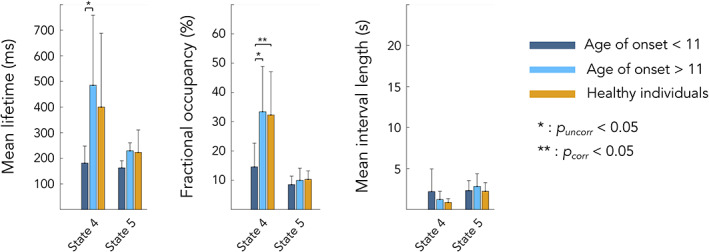
FIGURE 4.

Differences in HMM temporal parameters between healthy participants (orange), FRDA patients with age of symptoms onset <11 years (dark blue) and FRDA patients with age of symptoms onset >11 years (light blue). Statistical differences between groups are represented by bars along with p‐value. State 4 = posterior DMN state; state 5 = right angular gyrus state
