
FIGURE 4.
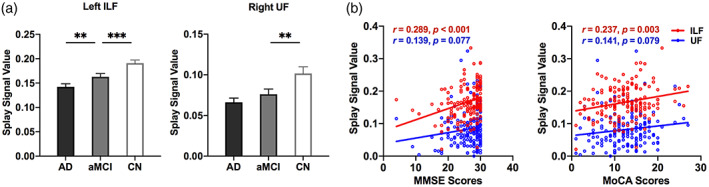
Tracts of interest analysis. (a) Comparison between CN, MCI, and AD. (b) Correlation between the splay of the orientation in tracts of interest and the cognitive performance. **, corrected p < .05; ***, corrected p < .01. AD, Alzheimer's disease; CN, cognitively normal; FA, fractional anisotropy; ILF, inferior longitudinal fasciculus; MCI, mild cognitive impairment; MoCA, Montreal cognitive assessment; MMSE, Mini‐Mental State Exam; UF, uncinate fasciculus