
FIGURE 2.
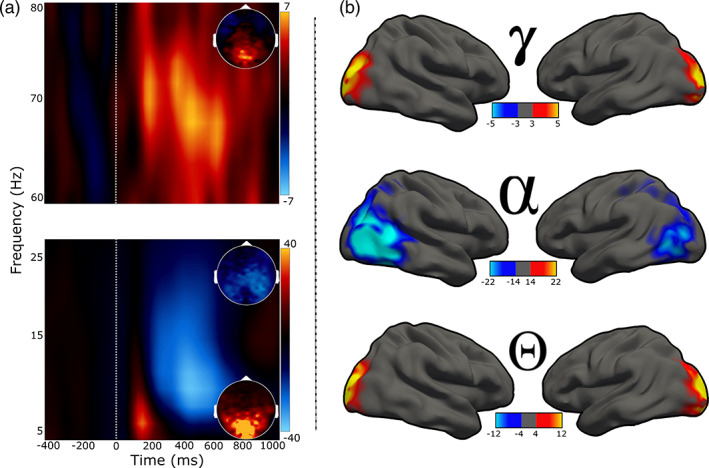
Neural responses serving visuospatial processing. (a): Spectrograms showing the three oscillatory responses identified at the MEG sensor level. Time (in ms) is denoted on the x‐axes, with 0 ms defined as the onset of the visual stimulus, and frequency (in Hz) is shown on the y‐axes. The lower spectrogram shows the theta (4–8 Hz, 25–275 ms) and alpha (8–14 Hz, 200–600 ms) responses, while the upper spectrogram shows the gamma (68–74 Hz, 200–600 ms) response. Insets show 2D power topographies of each oscillatory response grand‐averaged across the time–frequency windows of interest. (b): Activity from volumetric source images projected to the surface for visualization. Rows from top to bottom represent neural responses within the time and spectral windows of interest (i.e., gamma, alpha, theta). The color scale bars for spectrograms and 2D topographies (to the right of each plot), and for source maps (bottom of each plot) for each response reflects baseline‐normalized changes in power from the pre‐stimulus period