FIGURE 2.

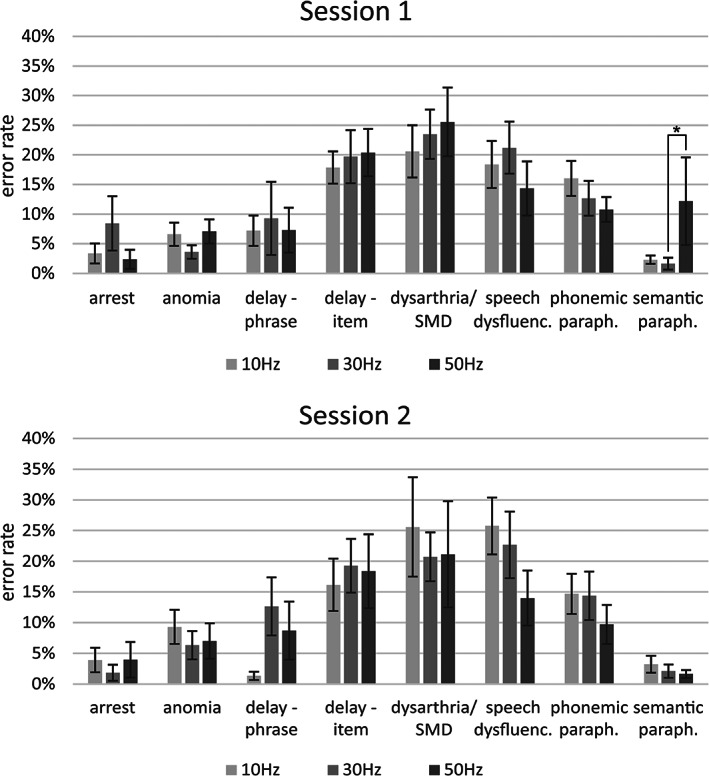
Number of errors within the different error categories relative to the total amount of errors (sum of all categories), mean ± SEM, *p ≤.05, FDR‐corrected

Number of errors within the different error categories relative to the total amount of errors (sum of all categories), mean ± SEM, *p ≤.05, FDR‐corrected