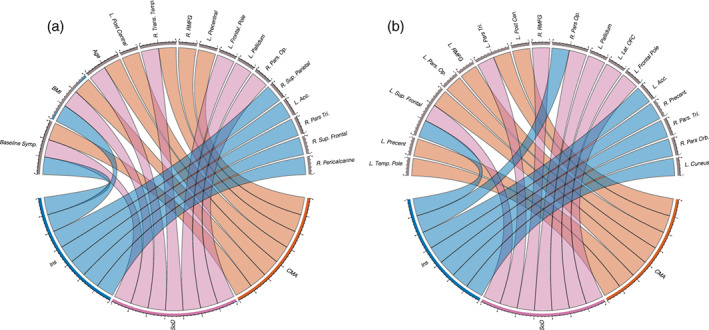
FIGURE 1.

Circular plots highlighting the most important predictors for (a) the full models including patient clinical, demographic, and regional volumetric change predictors and (b) models including only regional volumetric change predictors. Lower halves of the circles represent latent symptom dimensions while upper halves represent important predictors. Color‐coded lines connect symptom dimensions to the predictors that most informed their outcomes
