FIGURE 2.

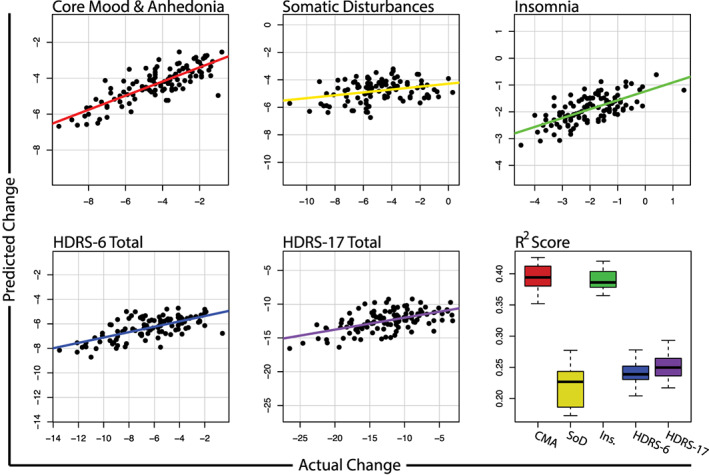
Predicted versus actual change along each latent symptom dimension, HDRS‐6, and HDRS‐17 total scores. Bottom right boxplot shows the distribution of scores obtained across repeated cross validation folds

Predicted versus actual change along each latent symptom dimension, HDRS‐6, and HDRS‐17 total scores. Bottom right boxplot shows the distribution of scores obtained across repeated cross validation folds