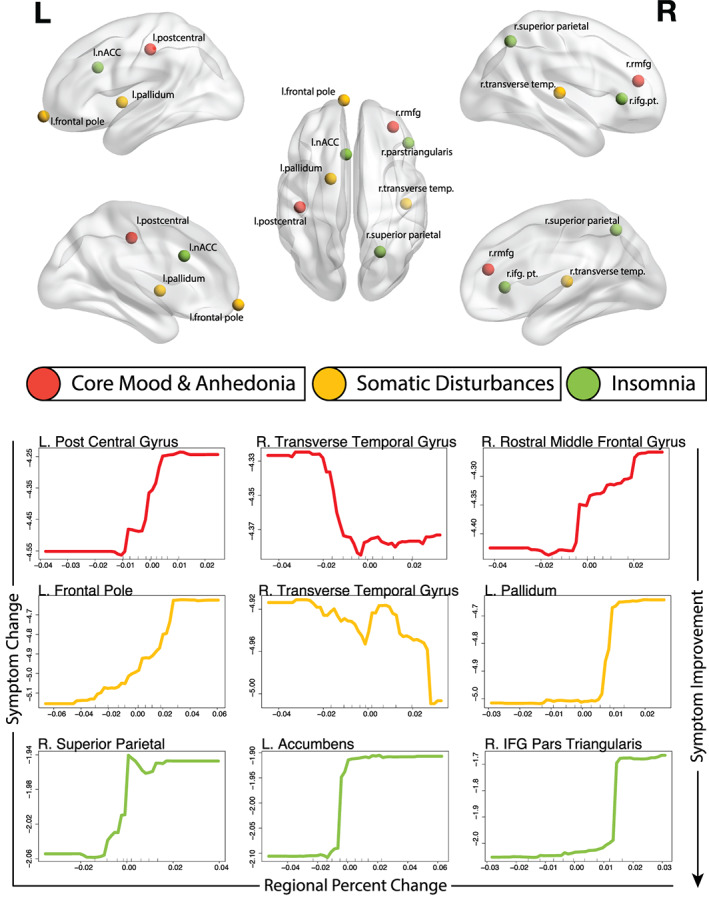
FIGURE 4.

Top: Locations of top three important brain regional change predictors illustrated in Montreal Neurological Institute (MNI) space. Bottom: Partial dependence plots illustrating the expected degree of symptom dimension change (y‐axis) for observed values of the important regional volumetric change predictors (x‐axis) while holding all other model predictors at their observed median values
