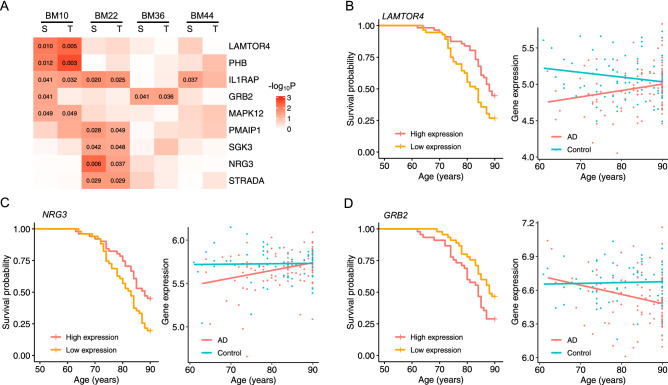
Figure 4.
AD survival curves and gene expression trajectories with age. We analyzed the expression of each AD risk gene to see how it may affect the survival of AD patients with low and high expression levels and how it trends with age in AD patients and normal controls. (A) The heatmap of P-values of Kaplan–Meier survival analyses and gene expression trend tests across four brain regions (see Methods). Nine AD risk genes with at least one P-value less than 0.05 (labeled) are included in the heatmap. This figure includes AD survival curves and gene expression trajectories with age for three genes with P < 0.05: (B) LAMTOR4 in the brain region BM10, (C) NRG3 in the brain region BM22, and (D) GRB2 in the brain region BM36. See Supplementary Fig. S10 for plots of other significant results.

