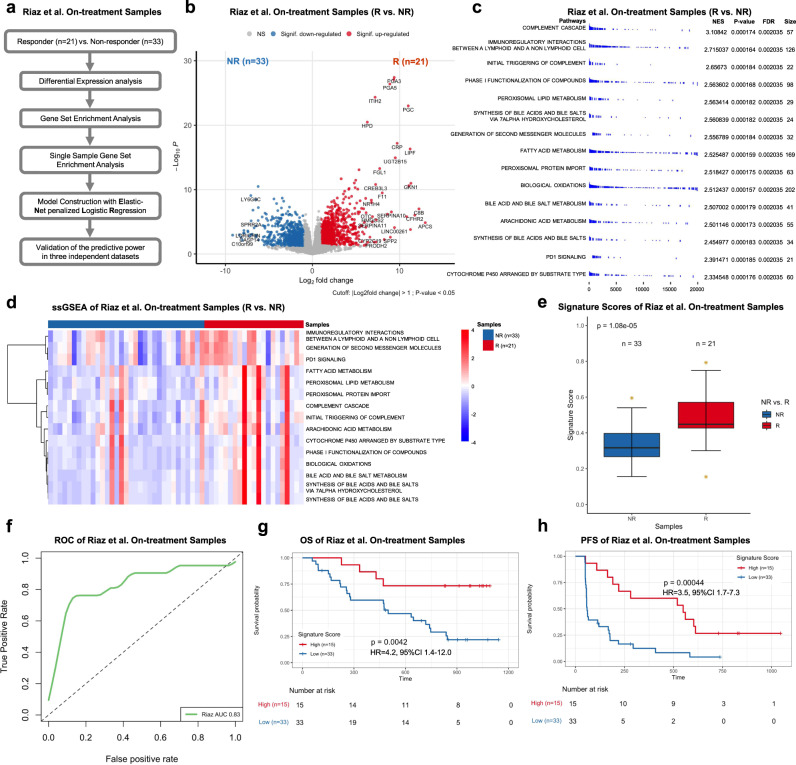
Fig. 4. Pathway-based super signature for on-treatment samples.
a The computational pipeline of model construction based on on-treatment samples in the Riaz et al. cohort. b The volcano plot of differential gene expression analysis between on-treatment responders (R) and nonresponders (NR) in the Riaz et al. cohort. Log2Fold change (FC) was calculated. The two-sided Wald test was implemented to test if no differential expression between responder and nonresponders. The blue dots represent significantly downregulated (Signif. downregulated) genes (log2Fold Change < −1, P-value < 0.05). The red dots represent significantly upregulated (Signif. upregulated) genes (log2Fold Change > 1, P-value < 0.05). The gray dots represent nonsignificant (NS) genes. c The GSEA results of 15 candidate pathways. Normalized Enrichment Score (NES) and the size of leading-edge geneset are calculated. The permutation based P-value shows the statistical significance of the enrichment score. The number of permutation is 10,000. False discovery rate (FDR) is the estimated probability that the normalized enrichment score represents a false positive finding. d The heatmap of ssGSEA values of on-treatment responders (R) and nonresponders(NR) in the Riaz et al. cohort. Nonresponders are presented on the left side, and responders are presented on the right side. FDR-corrected two-sided Welch t-test was conducted to compare ssGSEA values between R and NR samples, only FDR < 0.05 showed here. e The boxplot of on-treatment sample’s Pathway-based super signatures (PASS-ON) signature score of responders (R) and nonresponders (NR) with the number of samples showed in the Riaz et al. cohort. The P-value was computed via a one-sided rank-sum test. Boxplot center lines indicate medians, box edges represent the interquartile range, whiskers extend to the minimum and maximum, and the outliers are plotted individually using the ‘*’ symbol. f ROC and AUC of PASS-ON on the on-treatment samples in the Riaz et al. cohort. g, h The Kaplan–Meier analysis of overall survival (OS) (g) and progression-free survival (PFS) (h) of on-treatment samples in the Riaz et al. cohort. The two-sided log-rank test compared high and low subgroups based on the mean of on-treatment samples odd ratio as cutoff. Hazard ratio (HR) was calculated and shown with confidence interval (CI). Source data are provided as a Source Data file.

