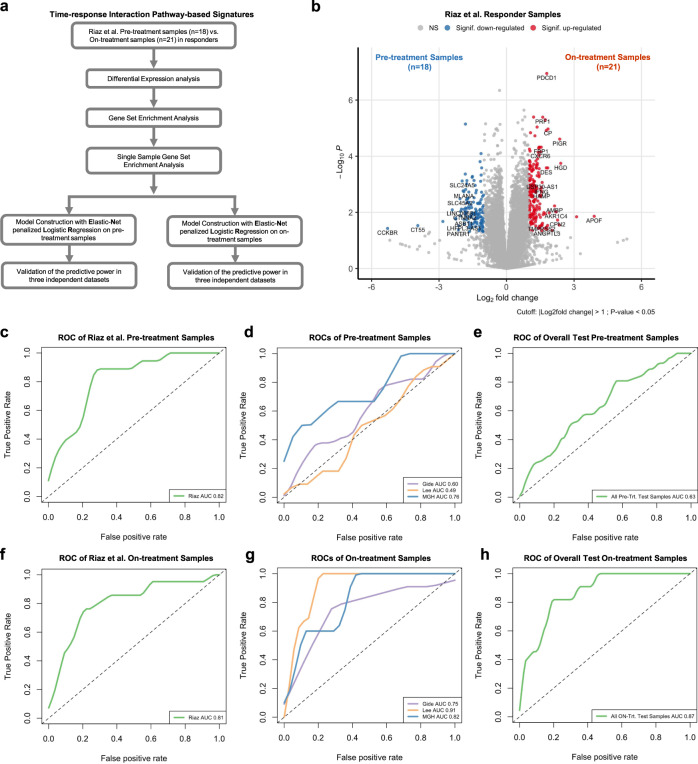
Fig. 6. Time-response interaction pathway-based super signatures for pre- and on-treatment samples.
a Computation pipeline of model construction of time-response interaction pathway-based Super Signatures. b The volcano plot of differential gene expression analysis of response pre-treatment and on-treatment samples in the Riaz et al. cohort. Log2Fold change (FC) was calculated. The two-sided Wald test was implemented to test if no differential expression between response pre-treatment and on-treatment samples. The blue dots represent significantly downregulated (Signif. downregulated) genes (log2Fold Change < −1, P-value < 0.05). The red dots represent significantly upregulated (Signif. upregulated) genes (log2Fold Change > 1, P-value < 0.05). The gray dots represent nonsignificant (NS) genes. c–e ROCs and AUCs of the time-response interaction pathway-based super signatures for pre-treatment samples (TimeANLS-PRE) from Riaz et al. cohort (c), Gide et al., Lee et al., and MGH cohorts (d), combined pre-treatment with Gide et al., Lee et al., and MGH cohorts (e). f–h ROCs and AUCs of the time-response interaction pathway-based super signatures for on-treatment samples (TimeANLS-ON) from Riaz et al. cohort (f), Gide et al., Lee et al., and MGH cohorts (g), combined on-treatment with Gide et al., Lee et al., and MGH cohorts (h). Source data are provided as a Source Data file.

