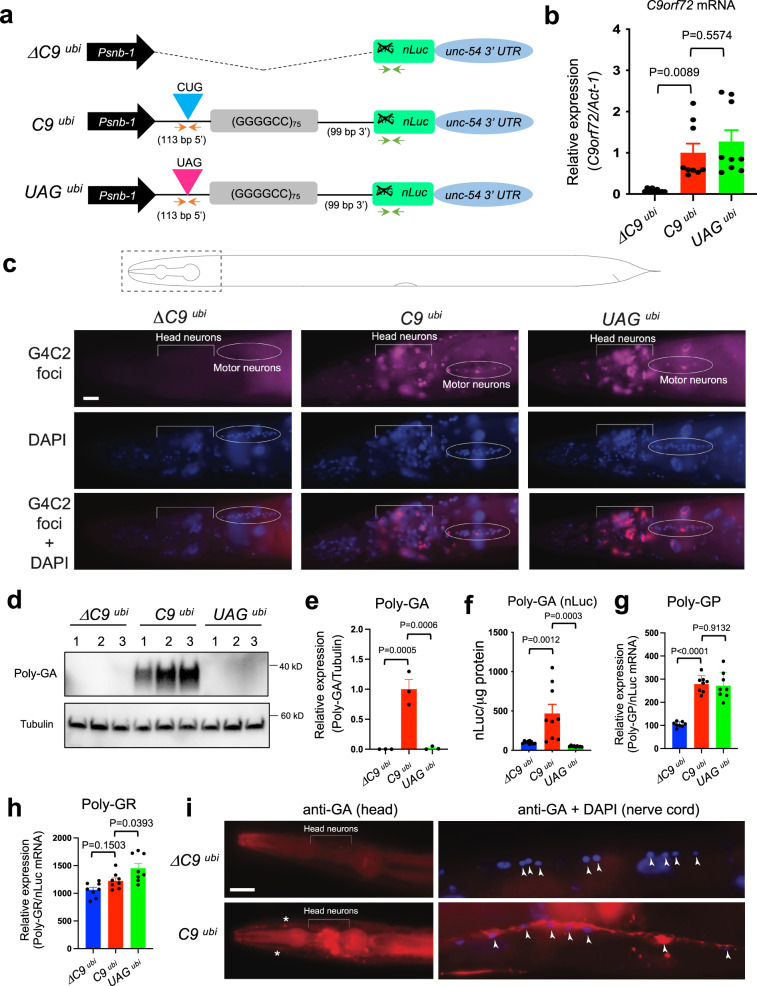
Fig. 1. A C. elegans model for C9orf72-mediated ALS/FTD.
a Schematic diagram showing ΔC9 ubi, C9 ubi, and UAG ubi constructs with the snb-1 promoter. The orange and green arrows show primer location to detect C9orf72 and nLuc mRNAs, respectively. nLuc: nanoluciferase; UTR: untranslated region. b The G4C2 repeat mRNA (C9orf72 intronic mRNA) and act-1 mRNA were assessed by RT-PCR on three different transgenic lines per genotype: ΔC9 ubi (kasEx154, kasEx259, kasEx260), C9 ubi (kasEx153, kasEx261, kasEx262), or UAG ubi (kasEx155, kasEx263, kasEx264) (mean ± s.e.m.). One-way ANOVA with Dunnett’s multiple comparisons test was performed. c Representative fluorescent images of the head of adult (day 1) ΔC9 ubi (kasIs9), C9 ubi (kasIs7) and UAG ubi (kasIs10) animals. N = 25. G4C2 RNA foci are visualized with a Quasar 670 probe. Nuclei are demarcated with DAPI (blue). Scale bar = 10 μm. G4C2 RNA foci are detected in head neurons and motor neurons of the retrovesicular ganglion (circled) both in C9 ubi and UAG ubi animals. The signal detected on the left of the region indicated “Head neurons” belongs to non-neuronal cells (no neurons reside that far anterior in the C. elegans head). d, e Western blotting with poly-GA and α-tubulin antibodies and quantification on three different transgenic lines per genotype: ΔC9 ubi (kasEx154, kasEx259, kasEx260), C9 ubi (kasEx153, kasEx261, kasEx262), or UAG ubi (kasEx155, kasEx263, kasEx264) (mean ± s.e.m.). One-way ANOVA with Dunnett’s multiple comparisons test was performed. f Luciferase assay was performed in worm lysates from the same three transgenic lines per genotype shown in panel e (mean ± s.e.m.). g, h ELISA for poly-GP and poly-GR in ΔC9 ubi (kasIs8), C9 ubi (kasIs7), and UAG ubi (kasIs10) animals (n = 4, mean ± s.e.m.). One-way ANOVA with Dunnett’s multiple comparisons test was performed. i Immunofluorescent staining for poly-GA (red) in ΔC9 ubi (kasIs9) and C9 ubi (kasIs10) adult (day 1) worms. Representative images of the head and ventral nerve cord region taken at ×40 magnification. N = 20. Anterior to the left. Motor neuron nuclei in blue (DAPI) shown with arrowheads. Scale bar = 20 μm.

