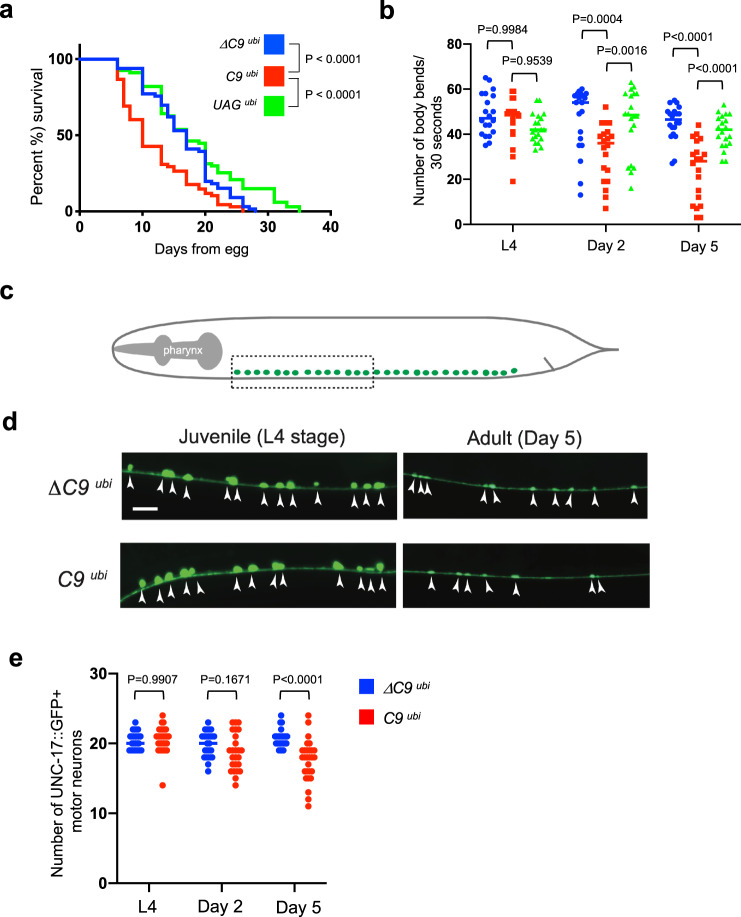
Fig. 2. Evidence for motor neuron degeneration and synaptic defects in C9 ubi animals.
a Lifespan of ΔC9 ubi (kasEx154, kasEx259, kasEx260), C9 ubi (kasEx153, kasEx261, kasEx262), and UAG ubi (kasEx155, kasEx263, kasEx264) animals. Three different transgenic lines per genotype were used and the results are combined per genotype. ΔC9 ubi, n = 66; C9 ubi, n = 68; UAG ubi, n = 67). See Supplementary Fig. 7. Mantel–Cox log-rank test was performed. b Swimming rates of ΔC9 ubi(kasIs9-blue), C9 ubi(kasIs7-red), and UAG ubi (kasIs10-green) worms at three different stages. n = 20. Two-way ANOVA with Šídák’s multiple comparison test was performed. c Schematic showing cholinergic motor neurons (green) in the C. elegans ventral nerve cord. Dashed box indicates the region used for imaging and quantification. d, e Motor neuron cell bodies are visualized with the vsIs48 [unc-17/VAChT::gfp] marker in ΔC9 ubi (KasIs9) and C9 ubi (KasIs7) animals at the indicated stages. Arrowheads indicate motor neuron cell bodies. Scale bar = 10 μm. e Quantification of the number of motor neurons at the anterior half of the nerve cord. L4 ΔC9 ubi: n = 25, day 2 ΔC9 ubi: n = 25, day 5 ΔC9 ubi: n = 25, L4 C9 ubi: n = 29, day 2 C9 ubi: n = 25, day 5 ΔC9 ubi: n = 28. Two-way ANOVA with Šídák’s multiple comparison test was performed.

