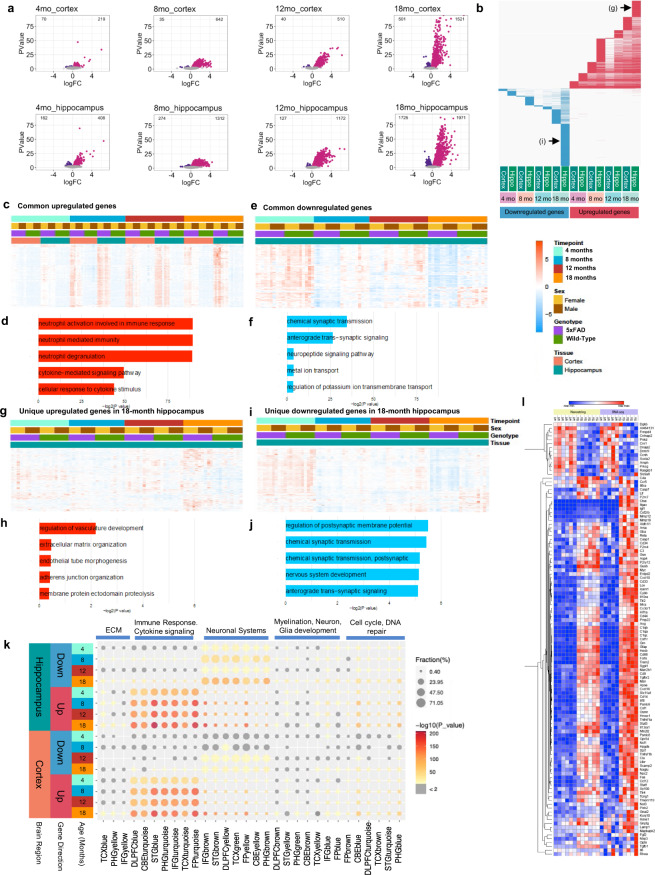
Fig. 8.
Differential gene expression analysis of the 5xFAD time course. (a) Comparisons of 5xFAD and WT were done across different timepoints and tissues. Upregulated genes are labeled in pink and down regulated genes are labeled in purple. Number of differential expressed genes is displayed in the upper corners of the volcano plot. Parameters FDR <0.05. (b) Comparison of differential expressed genes across timepoint and tissue. Upregulated genes in red, downregulated genes in blue. Each column represents a set of genes for a different time point, each row represents each one of the differentially expressed genes. Unique upregulated and downregulated gene sets representing in Fig. 7g,i are also indicated as (g) and (i) in this panel. (c,d) Heatmap and GO Term analysis for common genes upregulated. (e,f) Common downregulated genes, (g,h) Unique genes upregulated at 18 months in hippocampus, (i,j) Unique genes downregulated at 18 months in hippocampus. (k) Comparison of differentially expressed genes against AMP-AD modules. Size of the dot represents the fraction and color represents how much this fraction is significant. (l) NanoString nCounter Neuropathology Mouse Panel and RNA-seq heatmap comparison between 12-month-old female 5xFAD and WT hippocampus. Blue indicates down regulation and red indicates upregulation. Parameters FDR < 0.1.

