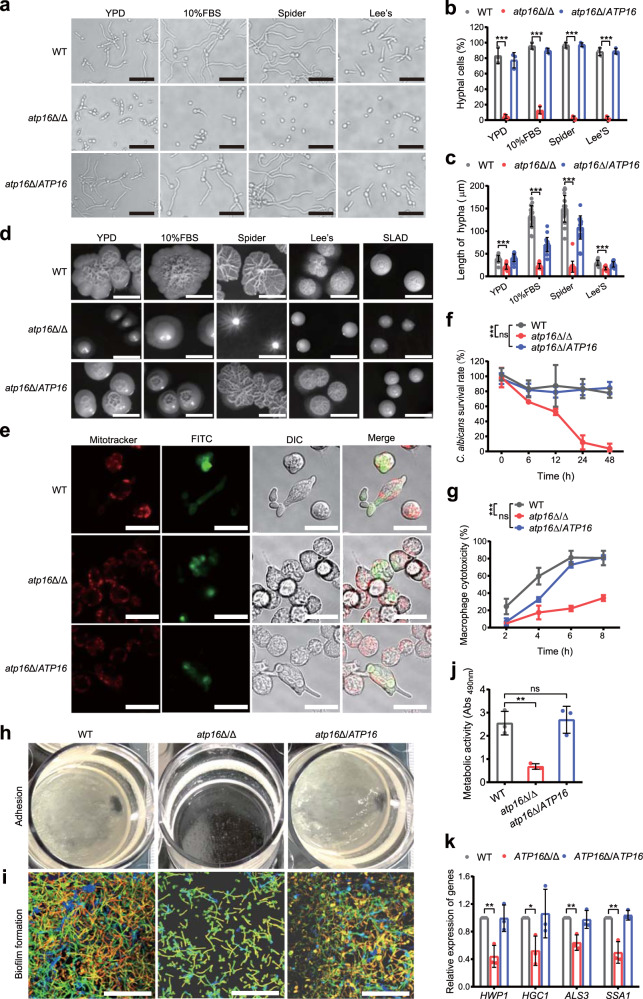
Fig. 4. Deletion of the δ subunit causes defective virulence.
a–d Hyphae formation of WT, atp16Δ/Δ and atp16Δ/ATP16 were induced in YPD, 10% FBS, Spider, Lee’s liquid (2 h) (a) and solid (7 d) (d) media at 37 °C. In a magnification ×400. Scale bar is 50 µM. In d scale bar is 1 cm. The percentage of hyphal cells (b) and the length of hyphae (c) were calculated from at least 100 and 20 cells in each group, respectively. e RAW264.7 macrophages preloaded with MitoTracker Deep Red FM (red) were cocultured with FITC-stained WT, atp16Δ/Δ and atp16Δ/ATP16 cells (green) at a 1:1 ratio in serum-supplemented DMEM and imaged after 3 h by confocal microscopy in the Ex644/Em655 (red), Ex488/Em525 (green) and DIC channels. Magnification ×630. Scale bar is 20 µM. f The C. albicans survival rates of WT, atp16Δ/Δ and atp16Δ/ATP16 cells by the cocultured with RAW264.7 macrophages within 48 h were determined by the end point dilution assay at each time point. g Macrophage cytotoxicity caused by WT, atp16Δ/Δ and atp16Δ/ATP16 were determined by the release of LDH. h Adhesion of WT, atp16Δ/Δ and atp16Δ/ATP16 cells to the plastic plate bottom after 24 h of shaking incubation at 37 °C. i, j Biofilm formation of WT, atp16Δ/Δ and atp16Δ/ATP16 after 6 h at 37 °C were observed by confocal microscopy in the Ex543/Em557 channel (i), and their metabolic activity was determined by XTT assay (j). Magnification ×630. Scale bar is 20 µM. k The mRNA expression levels of the virulence-related genes of WT, atp16Δ/Δ and atp16Δ/ATP16 cultured in Spider medium plus 0.2% glucose for 6 h as assessed by RT-qPCR. In a, d, e, h and i one representative experiment out of three independent experiments is shown. In f, g, j and k three independent experiments are shown. In b, c, f, g, j and k data expressed as the mean ± SD. *P < 0.05, **P < 0.01, ***P < 0.001; ns, not significant; by two-tailed unpaired Student’s t-test (b, c, j, k) and two-way ANOVA (f, g).

