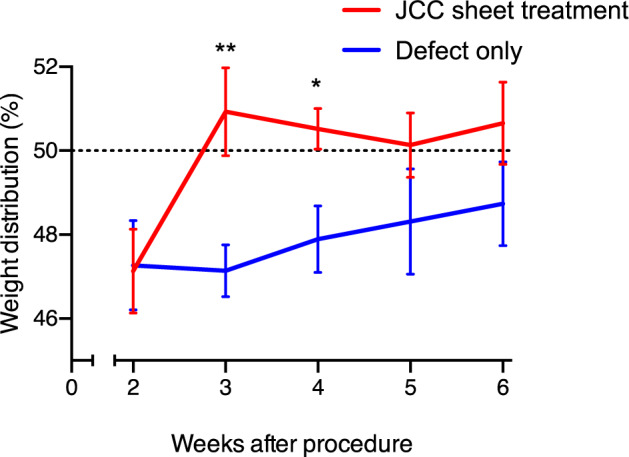
Fig. 7. Rodent weight-bearing test.

Weight distribution of rat left and right hind legs are measured, and percentages of treatment side weight bearing are shown. Sample numbers at week 2, 3, 4, 5, and 6 = 13, 12, 12, 8, and 8 (defect only group); = 16, 15, 15, 9, and 9 (defect + CS group), respectively. Data shown as mean and SEM. **p < 0.01, *p < 0.05 by Welch’s t test.
