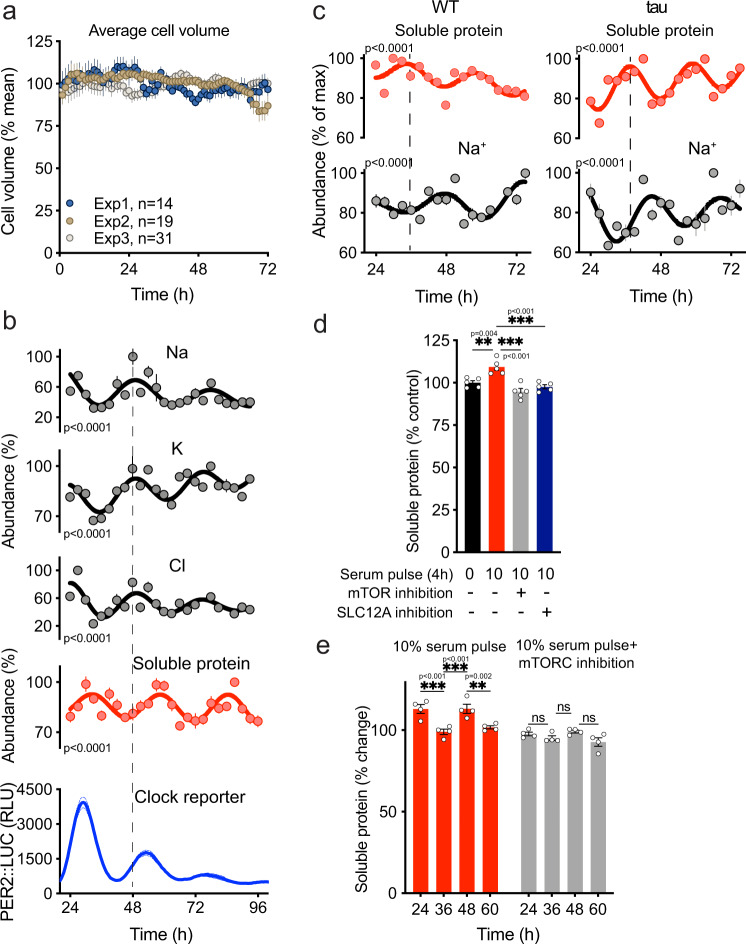
Fig. 2. Ion flux buffers changes in cytosolic protein abundance in mouse fibroblasts.
a Mean cell volume of fibroblasts across time from three independent recordings. Average cell volume data were normalized for the average of all values within each replicate. b Abundance of selected ions (n = 4), soluble protein (n = 3), and PER2::LUC bioluminescence recordings (n = 3) in fibroblasts. Abundance values were normalized for the maximal value in each timeseries. c Quantification of intracellular Na+ (n = 4) and labile cytosolic protein abundance (n = 3) in WT and tau mutant fibroblasts under constant conditions over 2 days. d % change in soluble protein upon 4 h treatment with 10% serum ± 50 nM mTOR inhibitor torin1 or 10% serum ± 50 μM DIOA and 100 μM Bumetanide (n = 3). e % fold increase in soluble protein upon 4 h treatment with 10% serum ± 50 nM mTOR inhibitor torin1 at indicated times (n = 4). Mean ± SEM shown throughout. p values in (b) and (c) indicate comparison of damped cosine wave with straight-line fit (null hypothesis = no rhythm). Statistical tests were one-way ANOVA and Tukey (d) and two-way ANOVA and Sidak’s MCT (e). Cell type used was lung fibroblasts for (c) and cardiac fibroblasts for (a, b, d, e).

