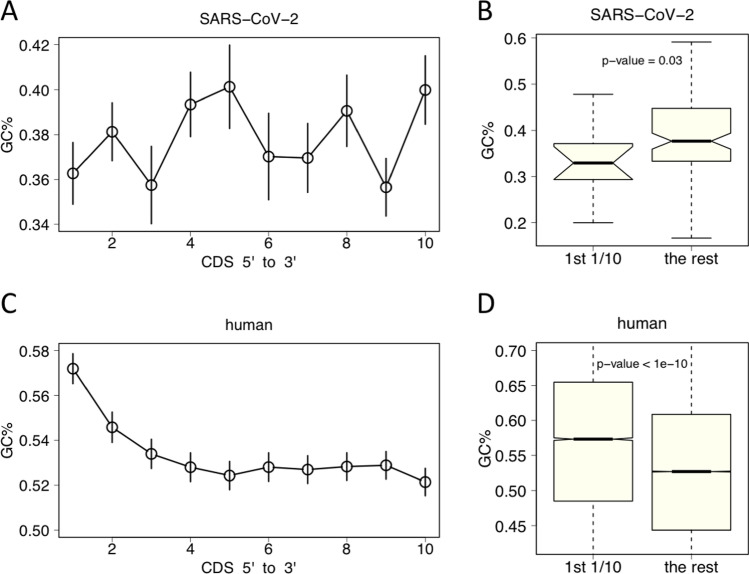
Fig. 2.
GC content at the 5-prime end of CDS. Each CDS is divided into 10 equal bins. The GC content is calculated within each bin. A For SARS-CoV-2, the GC% in the first bin (the first 1/10 at the 5-prime of CDS) is relatively low. Error bar is the S.E.M. of all genes. B In SARS-CoV-2, the GC% in the first bin is significantly lower than the other parts of CDS. t-test is used to calculate the p-value. C For human, the GC% in the first bin is very high. Error bar is the S.E.M. of all human genes. D In human, the GC% in the first bin is significantly higher than the other parts of CDS. t-test is used to calculate the p-value

