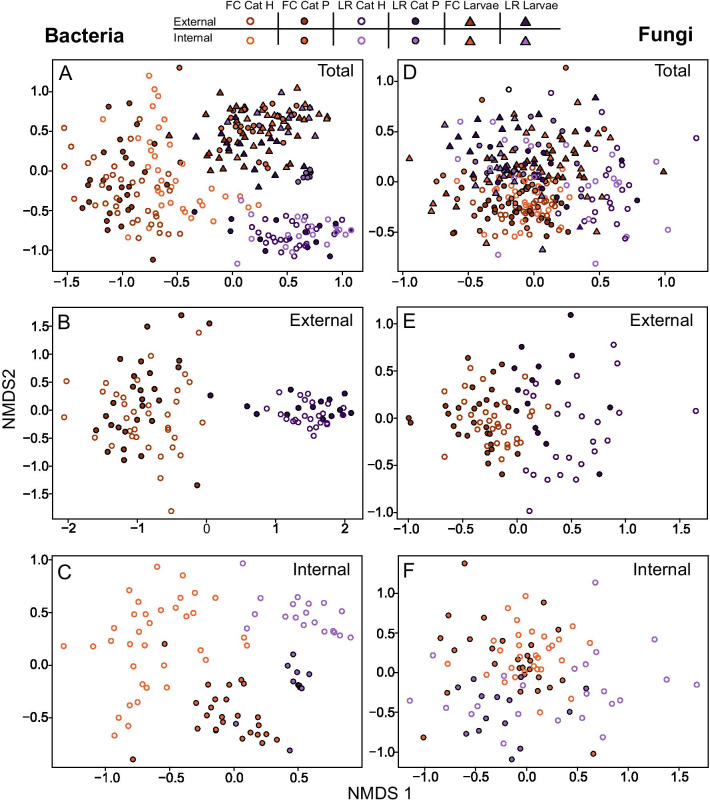
Fig. 2.
Non-metric multidimensional scaling (NMDS) ordination plots based on Bray–Curtis distances of Hellinger-transformed relative abundance data of the bacterial (A–C) and fungal communities (D–F) of the different caterpillars (Pieris brassicae) and parasitoid larvae (Cotesia glomerata) samples studied. Results for all samples are shown in A (stress = 0.181) and D (stress = 0.282). Results for the external samples are shown in B (stress = 0.170) and E (stress = 0.239), and for the internal samples in C (stress = 0.181) and F (stress = 0.266). Abbreviations used: Cat = caterpillars; H = healthy; P = parasitized; FC = field-collected; and LR = lab-reared

