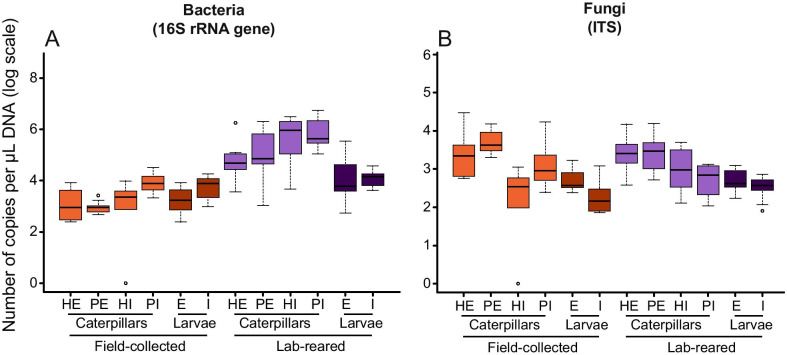
Fig. 3.
Boxplots showing the numbers of bacterial 16S rRNA gene (A) and fungal ITS copies (B) for the different caterpillars (Pieris brassicae) and parasitoid larvae (Cotesia glomerata) samples studied. Samples were divided in different subgroups according to habitat, organism, health status and origin for caterpillars, and habitat and origin for parasitoid larvae. The upper and lower whiskers correspond to the first and third quartiles, with the bar in the middle marking the median value. For each subgroup, ten random samples were analyzed. Abbreviations used: H = healthy; P = parasitized; E = external; and I = internal

